Download
1 / 48
480 likes | 597 Views
Putting ecosystem services on the map. Taylor Ricketts Conservation Science Program, World Wildlife Fund – U.S. Conservation Science Program, WWF. 25 people 10 PhDs 11 Masters Plus Interns Students Post-docs. Dual Roles Research Advisors to WWF Programs. Ecosystem Services.

E N D
Putting ecosystem services on the map Taylor Ricketts Conservation Science Program, World Wildlife Fund – U.S.
Conservation Science Program, WWF • 25 people • 10 PhDs • 11 Masters • Plus • Interns • Students • Post-docs • Dual Roles • Research • Advisors to WWF Programs
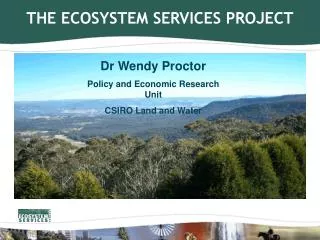
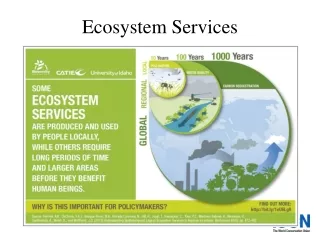
Ecosystem Services Natural processes through which ecosystems sustain and fulfill human life. • Links nature to human welfare • New motivation, funding for conservation • Poorly understood
Three projects Millennium Assessment 3 Spatial scale Natural Capital Project 2 Pollination meta-analysis 1 Pollination case study Number of services
Crop pollination apple tomato coffee • 2/3 of crops require it • Honeybee declines • Can wild bees to do the job? • Value of their habitats?
Questions • What is value of native habitats as sources of pollinators to surrounding crops? 1. Does pollinator activity decline with distance from native habitats? 2. Does this decline influence yields?
Design 0 1 2 km N Distance# sites Near (<100m) 4 Mid (0.8 km) 4 Far (1.6 km) 4 Near Med. Far Med. Near S
Pollinator activity • Timed observations • Diversity, visitation rate
Visitation rate Apis mellifera a ANOVA: p < 0.001 b b
Pollen deposition a ANOVA: p < 0.001 b b
Yield experiments • Two treatments • 1. Open • (ambient pollination) • 2. Hand-pollinated • (ensure sufficient pollination)
Hand > Open Not sufficient Experimental logic Question: are ambient pollination levels sufficient? Possible results: Hand = Open Sufficient
Results: seed mass ** ANOVA Distance: ns Treatment: ns D x T: p=0.004
Questions: • 1. Does pollinator activity decline • with distance from forest? • YES • Ricketts, Cons Bio 2004 • 2. Does this decline influence coffee yields? • YES • ~20% decrease beyond 1km • Ricketts et al., PNAS 2004
Numbers we need • Forest effects 1 km • Yield beyond 1km 17.8 fa*/ha • Yield within 1km 21.5 fa/ha • Net income $35/fa n (far) 1.0 km s * fanega = 200 liters Value of pollination services
Marginal change in forest 1.0 km 1.0 km Loss of area near forest: 480 ha Loss of income: $62,000
Are forests undervalued? • Pollination service value • $62,000 / 157 ha = $395/ha/year Environmental Service Payments • Carbon sequestration • Hydrological services • Scenic beauty • Biodiversity $42/ha/year Underestimate: other services, other farms
Three projects Millennium Assessment Spatial scale 2 Pollination meta-analysis 1 Pollination case study Number of services
How general is coffee result? • 16 crops • Almond • Atemoya • Canola (2) • Tomato • Watermelon (3) • Coffee (3) • Eggplant • Field Bean • Grapefruit • Kiwifruit • Longan • Macadamia (2) • Muskmelon • Oil palm • Passion fruit • Sunflower (2) • 23 studies • 18 published, in press • 5 in review, preparation Any general lessons? 10 countries
Exponential decay model P = α* e(β*D) • α: intercept • β: decay rate Native visitation Distance
Hierarchical Bayesian modeling • Estimates probability distribution of “mean β,“ given all studies • αestimated separately for each study • Better fits = more influence • Stochastic sampling approach (WinBUGS) • Flat priors Probability “ Mean β“
Native visitation rates • Number of visits / flower / minute • Both means and certainties vary P = 0.004 Probability Decay rate (β) Overall meanβ Ricketts et al. 2008. Ecol. Letters.
Overall effect of distance Point of 50% decline: 668m (395-1727m) Native visitation Distance (m)
Pollinator richness (19 studies) P = 0.002 Probability Point of 50% decline: 1507m (921-3332m) Overall meanβ Richness • shallower decline • species present, but lower abundances Distance (m)
Fruit or seed set (12 studies) P = 0.162 Probability Point of 50% decline: 26,826m (5038-NA) Overall meanβ • No overall decline detected • sufficient pollination at low abundances • crops self-compatible • experiments difficult Fruit/seed set Distance (m)
How does this help? • Ecology • Search for general patterns in nature • Landscape effects on pollination • Conservation • Map ecosystem services • Inform landscape planning • Predict effects of land use change
Three projects Millennium Assessment Most policy relevance 3 Spatial scale • “Landscape level quantification of economic values of entire bundles of ecosystem services under alternative management regimes” -Carpenter et al. Science. 2006. Natural Capital Project 2 Pollination meta-analysis 1 Pollination case study Number of services
The Natural Capital Project • Develop tools to map, value ecosystem services • Test & apply tools in critical ecoregions • Support policies to maintain / pay for services • Change the way ecosystems are viewed InVEST
Questions for InVEST 31 • What places provide the most ecosystem services? • How would a proposed logging project affect different ecosystem services and biodiversity? • What landscape pattern would optimize ecosystem services now and under likely scenarios? • Who should pay whom under a proposed ‘PES’ program, and how much?
InVEST • Biodiversity • Pollination • Carbon Storage, Sequest. • Timber & NTFP Production • Water quality • Water quantity and timing • Agricultural production • Recreation / Tourism • Cultural and Non-use Built so far
Tiered Approach 33 Tier 1 Tier 2 Models (typical) Simple Complex Data (typical) Doable anywhere (?) Relative scores More detail Absolute estimates
Pollination model Pollinator source abundance Fly to pollinate crops Effect on crop yield Distribute value to source A A Y P A Kremen, et al. 2007. Ecology Letters Lonsdorf, et al. 2009. Annals of Botany
Testing in Costa Rica Source abundance Contribution to coffee yield Source value
Validating model results Observed on-farm abundance • Good fits • Simple model • Simple data (experts) Predicted on-farm abundance Lonsdorf, et al. 2009. Annals of Botany
Four Demonstration Sites Sierra Nevada Upper Yangtze Hawai’i Eastern Arc Mtns • test, refine InVEST with field partners and experts • support conservation goals
Early results Water yield ~f(rain, ET, topo, soils) Carbon storage ~f(storage/ha, harvest, decay) Charcoal harvest ~f(stock/ha, access, protection)
InVEST interface http://invest.ecoinformatics.org Kareiva, et al. (in prep). Theory and Practice of Ecosystem Services. Oxford.
How does this help? • Locate win-win areas for conservation • Target payments for services • Engage those deciding things • Demonstrate economic importance of nature • Connect conservation to people www.naturalcapitalproject.org www.valuingthearc.org
Putting ES on the map Millennium Assessment 3 Spatial scale Natural Capital Project 2 Pollination meta-analysis 1 Pollination case study Number of services
NatCap / Valuing the Arc Andrew Balmford Neil Burgess Gretchen Daily Brendan Fisher Peter Kareiva Eric Lonsdorf Guillermo Mendoza Shadrack Mwakalila Robin Naidoo Erik Nelson Nasser Olwero Steve Polasky Jim Regetz Mathieu Rouget Ruth Swetnam Heather Tallis Buzz Thompson Kerry Turner Sue White Michael Wright … Thanks… Pollination Paul Ehrlich Jaime Florez Geoff Heal David Inouye Ailene Kane Claire Kremen Maya Hayden Charles Michener Brad Reed David Roubik Neal Williams OTS Finca Santa Fe The Fallas family … Support NSF-NCEAS NASA Leverhulme Trust Packard Foundation MacArthur Foundation Moore Foundation Summit Foundation Roger and Vicki Sant Peter and Helen Bing …
Three possibilities • 2. Apis behavior • Move less among plants? • Able to fill corbiculae with fewer visits? • 3. Hand-pollination treatments • Damage or “clog” stigmas? • Yields lower than potential? • 1. Apis arrival time • Stigmas receptive only a few hours • Arrive later in far sites?
Pollen manipulations c a b b b manipulated open
Big picture Decisions Incentives & Restrictions Scenarios & actions • Policy / Finance • How use information? • PES, gov programs • WRI collaborations? Institutions Ecosystems InVEST Production functions Information Services Value Valuation Daily et al. in press. Frontiers in Ecology & Evolution