Download
1 / 25
270 likes | 508 Views
Ecosystem Services. CO. 2. External Costs. The loss of many of these ecosystem services is a social cost. It is not a transaction cost when converting to a more intensive land use. (Example: Clearing forests for a development)

E N D
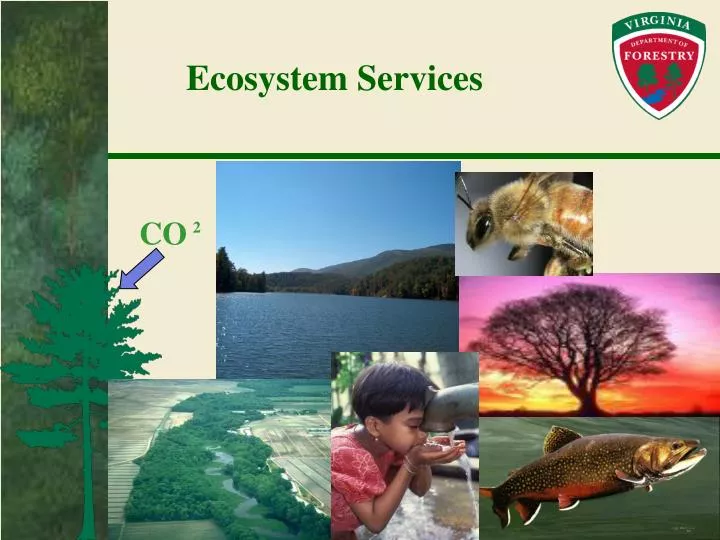
Ecosystem Services CO 2
External Costs • The loss of many of these ecosystem services is a social cost. It is not a transaction cost when converting to a more intensive land use. (Example: Clearing forests for a development) • Regulatory drivers (wetlands legislation, cap& trade legislation) and voluntary drivers (managing the corporate environmental footprint, socially responsible investing strategies, and public relations efforts) can help internalize the social costs. • How can regulatory and voluntary drivers helplandowners capture a value for ecosystem services and helpcommunities to smartly manage growth?
3 Million More People1 Million Fewer Forest Acres Population Forest Land
Virginia Status FY 2006-2007 saw a net loss of an additional 27,300 acres of forest land • How can we enhance landowner participation in existing and emerging ecosystem service markets? • What tools can we provide to state and local government to smartly manage growth and mitigate environmental impacts?
Our $25 billion Industry Needs Support to Conserve Forest Land! • We can’t get our water quality offshore • We can’t get our wildlife habitat offshore • We can’t get our viewsheds offshore • We can’t get our air quality offshore
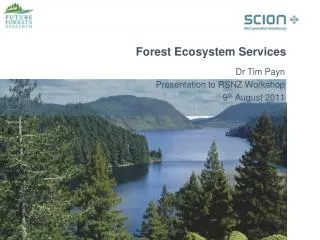
A Climate Change Atlas for 80 Forest Tree Species of the Eastern United States Anantha M. Prasad and Louis R. Iverson USDA Forest Service, Northeastern Research Station, http://www.nrs.fs.fed.us/atlas/
5 Models of Global Climate Change at 2X CO2 All five models show an increase in importance for southern yellow pines and the xeric oaks *NOTE: These predictions demonstrate potential changes in suitable habitat conducive to a particular species establishment
Summary of DOF Effort • Ecosystem Service Workgroup • Identify “front-burner” services • Identify metrics for credit calculation • Explore opportunities for markets and ecosystem-based mitigation • Any effort must compliment existing state programs and regulatory drivers
Current Efforts • Carbon Sequestration • Water Quality • Nutrient load reduction • Sediment loading/infiltration • Air Quality • Wildlife/Biodiversity Increasing degree of difficulty
Credit CalculationThe Foundation of the Effort • Good metrics are important • Must be backed by science • Must meet existing regulatory criteria QUALITY CREDIT (Quantity for market or mitigation)
Additionality Test To be considered for an offset credit: • New forest management projects provide for ecosystem services above and beyond what currently is provided by existing forest lands. • It is a choice between a technological solution and an environmental solution. It is not “paying to pollute”. Examples: Cropland conversion for water quality nutrient load reduction, Afforestation for carbon sequestration
Environmental or Technological Solution? AND/OR CAP
Water Quality Efforts(Sediment Load & Nutrient Load Reduction) Chesapeake Bay Nutrient Credit Trading • DEQ/DCR have developed the regulations • Practices • Crop, hay, and pastureland conversion to forests • Ag BMPs that reduce Nitrogen and Phosphorus Loading • Must meet baseline requirements Waste Water Treatment Plant
Water Quality Efforts Sediment Load Reduction – Infiltration • Practices • Ag land conversion to Forest • Stream restoration work • Potential Applications • Municipal water supplies (reservoir life, treatment costs) • Stormwater management • TMDLs
How Does Forest Cover Influence Air Quality? Pollutants (ozone, PM, SOx, NOx) • Objectives • Determine a science based physical measure for air quality credits • Explore voluntary mitigation opportunities or market-based solutions
Air QualityDr. David Nowak, USFS Trees and Air Pollution • Physiological – take in through stomata during photosynthesis • Physical – aerodynamic drag and surface conductance causes surface deposition Flux Equation (F=VdC) • F is downward flux of air pollution • Vd is velocity of deposition • C is concentration of air pollutant Basis for EPA allowing forest cover/tree canopy as a voluntary measure in State Implementation Plans (SIPs)
Developing the Tools(Virginia Tech Effort) • Are creating a pilot GIS-enabled tract-based ecosystem service credit calculator tool that will provide spatially-referenced information • Tool will incorporate existing GIS data and inventoried inputs (species, age, stocking) • Starting with carbon (aboveground biomass) and water quality (sediment/nutrients)
Developing the Tools(Carbon) • User can select tract via spatial or database query, then calculate potential carbon storage for desired period • Alternative land use and management options available for “what-if” scenarios (growth and yield model)
Automated Credit Calculation Tool (WQ, C02) Cost Share Programs Landowners Incorporate tool Into GIS County Government Resource Managers State Agencies Easement Programs Quality Credit Registry/Exchange
Carbon Sequestration Project 18 acres afforested Nutrient Credit Trading Project 8 acres Virginia Landowner 87 acres total forested acres in municipal watershed Wetlands Mitigation Project – 11 acres Riparian Buffer to be planted – 12 acres
Federal Cap & Trade Regulated Entities (3 choices) Reduce Emissions Offsets Trade Allowances Exchange Verification Spatial Registry $ Aggregator/Banker/ Consultant GIS Tool Landowner
Needs • Resource Managers trained in developing ecosystem service portfolios and marketing those services • Landowner Education • Cost analyses to enhance the landowner and community based decision making process • Development process must be dynamic to reflect legislation, existing agency programs, and regulatory drivers. Collaboration is needed. • Create a multiple-use product (markets, voluntary mitigation, land-use planning, program prioritization) • Marketing strategy for voluntary credit purchases (Corporate stewardship, socially responsible investing (SRI), public relations, etc.) • Progress forward is dependent on funding opportunities and bullet #4
SAVE THE DATE Ecosystem Services: Marketing Environmental Solutions March 12-13, 2009