Download
1 / 26
260 likes | 390 Views
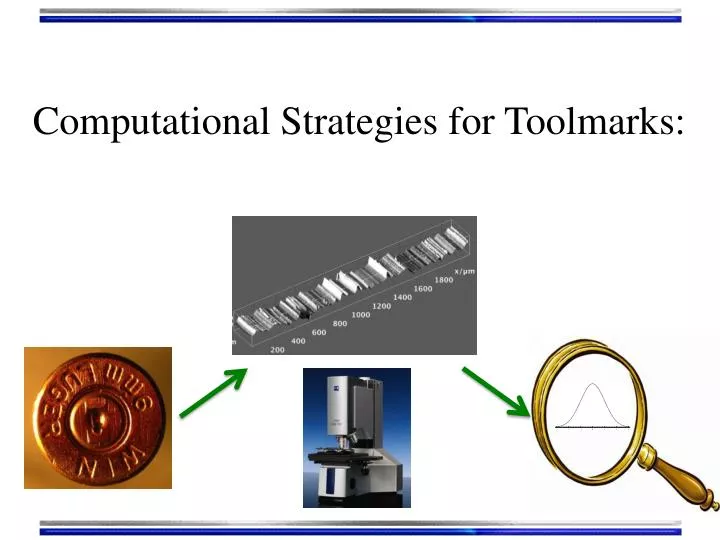
Computational Strategies for Toolmarks:. Outline. Introduction Details of Our Approach Data acquisition Methods of statistical discrimination Error rate estimates Measures of a association quality Future directions. Background Information.

E N D
Outline • Introduction • Details of OurApproach • Data acquisition • Methods of statistical discrimination • Error rate estimates • Measures of a association quality • Future directions
Background Information • All impressions made by tools and firearms can be represented as numerical patterns • Machine learning trains a computer to recognize patterns • Can give “…the quantitative difference between an identification and non-identification”Moran • Can yield identification error rate estimates • May be even confidence measures for I.D.s……
Data Acquisition • Obtain striation/impression patterns from 3D confocal microscopy • Store files in ever expanding database • Data files are available to practitioner and researcher community through web interface
Glock Fired Cartridges Bottom of Firing pin imp. Glock 19 fired cartridge cases
Screwdriver Striation Patterns in Lead 3D surfaces (interactive) 2D profiles
Mean total profile: Mean “waviness” profile: Mean “roughness” profile:
Profile Simulator • We can simulate profiles as well • Based on DWT MRA • May shed light on processed generating surfaces • Should be extendable to 2D striations/impressions…
What Statistics Can Be Used? • Multivariate statistical pattern comparison! • Modern algorithms are called machine learning • Idea is to measure features of the physical evidence that characterize it • Train algorithm to recognize “major” differences between groups of features while taking into account natural variation and measurement error.
Setup for Multivariate Analysis • Need a data matrix to do machine learning Represent as a vector of values {-4.62, -4.60, -4.58, ...} • Each profile or surface is a row in the data • matrix • Typical length is ~4000 points/profile • 2D surfaces are far longer • HIGHLY REDUNDANT representation • of surface data • PCA can: • Remove much of the redundancy • Make discrimination computations • far more tractable
3D PCA 24 Glocks, 720 simulated and real primer shear profiles: • How many PCs should we use to represent the data?? • No unique answer • FIRST we need an algorithm to I.D. a toolmark to a tool • ~47% variance retained
Support Vector Machines • Support Vector Machines (SVM) determine efficient association rules • In the absence of any knowledge of probability densities SVM decision boundary
PCA-SVM • How many Principal Components should we use? With 7 PCs, expect ~3% error rate With 13 PCs, expect ~1% error rate
Error Rate Estimation • Cross-Validation: hold-out chunks of data set for testing • Known since 1940s • Most common: Hold-one-out • Bootstrap: Randomly selection of observed data (with replacement) • Known since the 1970s • Can yield confidence intervals around error rate estimate • The Best: Small training set, BIG test set
18D PCA-SVM Primer Shear I.D. Model, 2000 Bootstrap Resamples Refined bootstrapped I.D. error rate for primer shear striation patterns= 0.35% 95% C.I. = [0%, 0.83%] (sample size = 720 real and simulated profiles)
How good of a “match” is it? Conformal Prediction • Derived as an approximation to algorithmic information theory of Solomonoff, Kolmogorov and Chaitin • Independent of data’s probability density • Compare “non-conformity” of questioned toolmark to known toolmarks • For each questioned toolmark, CPT outputs a “confidience interval” of possible I.D.s • For 95%-CPT confidence intervals will not contain the correct I.D. 5% of the time in the long run • This is an orthodox “frequentist” approach
Conformal Prediction • Can give a judge or jury an easy to understand measure of reliability of classification result • Confidence on a scale of 0%-100% Empirical Error Rate: 5.3% Theoretical (Long Run) Error Rate: 5% 14D PCA-SVM Decision Model for screwdriver striation patterns
Empirical Bayes’ • Computer outputs an I.D. for an questioned toolmark • This is a “match” • What’s the probability it is truly not a “match”? • Similar problem in genomics for detecting disease from microarray data • They use dataandBayes’ rule to get an estimate • No diseasegenomics = Not a true “match”toolmarks
Empirical Bayes’ • When computer associates a tool with a toolmark it also can output a score • We use “Platt-scores” from an SVM
Empirical Bayes’ • Use Storey-Tibshirani based method to get estimate of “mixture” probability mass function • Mass for z-scores of KM and KNM • From fit histogram by Efron’s method to get: • Crucial: can test the fits to • and ! z-score
Empirical Bayes’ • From this fit and Bayes’ Rule we can getEfron: Names: Posterior error probability (PEP) Estimated probability of not a true “match” given the algorithms' output z-score associated with its “match” Local false discovery rate (lfdr) • Suggested interpretation for casework: = Estimated “believability” of machine made “match”
Empirical Bayes’ • Brad Efron’s machinery for “empirical Bayes’ two-groups model” gives required fits • Get a “Believability” for all z, i.e. for all “matches” • Calibrated, falsifyable “belief” model The SVM alg got these Primer shear IDs wrong
Empirical Bayes’ • Model’s use with crime scene “unknowns”: This is an uncertainty in the estimate This is the est. post. prob. of no association = 0.00027 = 0.027% Computer outputs “match” for: unknown crime scene toolmarks-with knowns from “Bob the burglar” tools
Future Directions • Extend ImageJsurface metrology functionality • Eliminate alignment step • Try invariant feature extraction • Parallel implementation of computationally intensive routines • Standards board to review statistical methodology/algorithms
Acknowledgements Grad/Undergrad students • Helen Chan • Julie Cohen • Aurora Dimitrova • FraniKammerman • Loretta Kuo • Dale Purcel • Stephanie Pollut • Chris Singh • Melodie Yu Practitioners/academics • Research Team: • Mr. Peter Diaczuk • Ms. Carol Gambino • Dr. James Hamby • Dr. Brooke Kammrath • Dr. Thomas Kubic • Mr. Chris Lucky • Off. Patrick McLaughlin • Dr. Linton Mohammed • Mr. Jerry Petillo • Mr. Nicholas Petraco • Dr. Graham Rankin • Dr. Jacqueline Speir • Dr. Peter Shenkin • Mr. Peter Tytell
Website Information and Reprints/Preprints: toolmarkstatistics.no-ip.org/ npetraco@gmail.com npetraco@jjay.cuny.edu