Download
1 / 1
10 likes | 199 Views
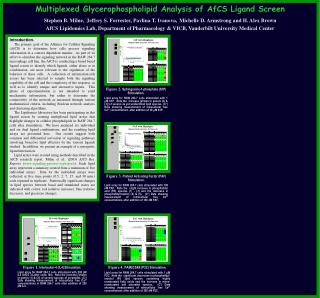
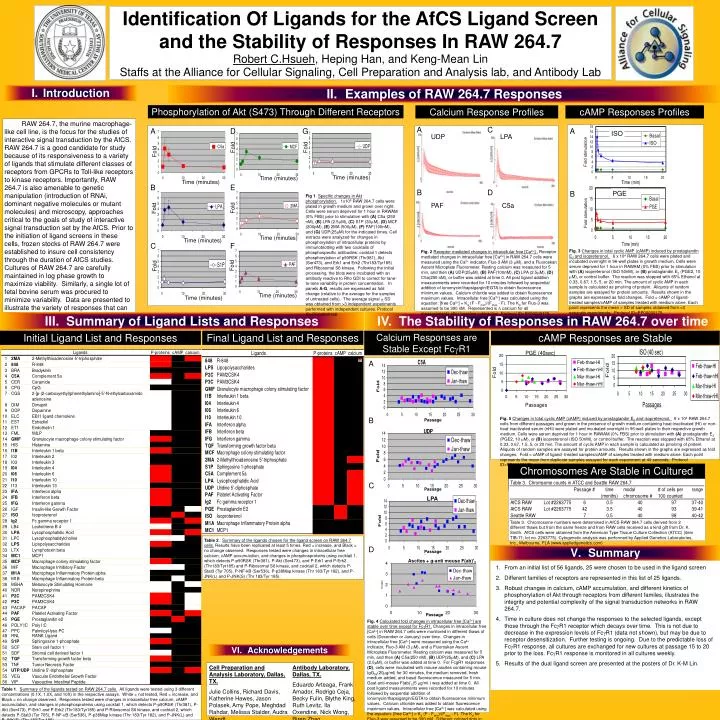
Fold. Fold. Fold. Time (minutes). Time (minutes). Time (minutes). Introduction. Fold. Fold. Fold. Fold. Phosphorylation of Akt (S473) Through Different Receptors. Calcium Response Profiles. cAMP Responses Profiles.

E N D
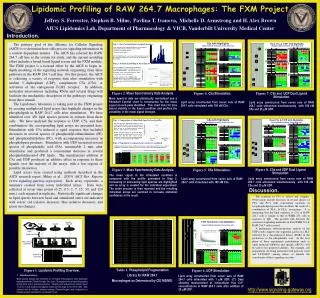
Fold Fold Fold Time (minutes) Time (minutes) Time (minutes) • Introduction Fold Fold Fold Fold Phosphorylation of Akt (S473) Through Different Receptors Calcium Response Profiles cAMP Responses Profiles RAW 264.7, the murine macrophage-like cell line, is the focus for the studies of interactive signal transduction by the AfCS. RAW 264.7 is a good candidate for study because of its responsiveness to a variety of ligands that stimulate different classes of receptors from GPCRs to Toll-like receptors to kinase receptors. Importantly, RAW 264.7 is also amenable to genetic manipulation (introduction of RNAi, dominant negative molecules or mutant molecules) and microscopy, approaches critical to the goals of study of interactive signal transduction set by the AfCS. Prior to the initiation of ligand screens in these cells, frozen stocks of RAW 264.7 were established to insure cell consistency through the duration of AfCS studies. Cultures of RAW 264.7 are carefully maintained in log phase growth to maximize viability. Similarly, a single lot of fetal bovine serum was procured to minimize variability. Data are presented to illustrate the variety of responses that can be measured in these cells and the stability of the cells under these culture conditions. Time (minutes) Time (minutes) Time (minutes) Time (minutes) A C A A D G ISO UDP LPA Fold stimulation [calcium] [calcium] B E B D PGE B Fig 1. Specific changes in Akt phosphorylation. 1x10⁶ RAW 264.7 cells were plated in growth medium and grown over night. Cells were serum deprived for 1 hour in RAWAM (0% FBS) prior to stimulation with (A) C5a (250 nM), (B) LPA (2.5mM), (C) S1P (30M), (D) MCF (200pM), (E) 2MA (500M), (F) PAF(100nM), and (G) UDP(25M) for the indicated times. Cell extracts were analyzed for changes in phosphorylation of intracellular proteins by immunoblotting with two cocktails of phosphospecific antibodies: cocktail 1 detects phosphorylation of p90RSK (Thr381), Akt (Ser473), and Erk1 and Erk2 (Thr183/Tyr185) and Ribosomal S6 kinase. Following the initial processing, the blots were incubated with an antibody reactive to Rho GDI to correct for lane-to-lane variability in protein concentration. In panels A-G, results are expressed as fold change (relative to the average for the samples of untreated cells). The average signal + SD was obtained from >3 independent experiments performed with independent cultures. Protocol ID=PP00000168 PAF C5a Fold stimulation [calcium] [calcium] C F Fig. 3Changes in total cyclic AMP (cAMP) induced by prostaglandin E2 and isopreteronol. 6 x 10⁴ RAW 264.7 cells were plated and incubated overnight in 96-well plates in growth medium. Cells were serum deprived for 1 hour in RAWAM (0% FBS) prior to stimulation with (A) isopreteronol (ISO 50nM), or (B) prostaglandin E2 (PGE2, 10 M), or control buffer. The reaction was stopped with 65% Ethanol at 0.33, 0.67, 1.5, 5, or 20 min. The amount of cyclic AMP in each sample is calculated as pmol/mg of protein. Aliquots of random samples are assayed for protein amounts. Results shown in the graphs are expressed as fold changes. Fold = cAMP of ligand- treated samples/cAMP of samples treated with medium alone. Each point represents the mean ± SD of samples obtained from >3 separate experiments. Protocol ID=PP00000175 Fig. 2 Receptor mediated changes in intracellular free [Ca2+] .Receptor mediated changes in intracellular free [Ca2+] in RAW 264.7 cells were measured using the Ca2+ indicator, Fluo-3 AM (3 M), and a Fluoroskan Ascent Microplate Fluorometer. Resting calcium was measured for 5 min, and then (A) UDP(25M), (B) PAF(100nM), (C) LPA (2.5M), (D) C5a(250 nM), or buffer was added at time 0. All post ligand addition measurements were recorded for 10 minutes followed by sequential addition of ionomycin/thapsigargin/EGTA to obtain fluorescence minimum values. Calcium chloride was added to obtain fluorescence maximum values. Intracellular free [Ca2+] was calculated using the equation: [free Ca2+] = Kd (F - Fmin)/(Fmax - F). The Kd for Fluo-3 was assumed to be 390 nM. Represented is calcium for all measurements after baseline subtraction. Protocol ID=PP00000176 A B Passage Fig. 5Changes in total cyclic AMP (cAMP) induced by prostaglandin E2 and isopreteronol. 6 x 10⁴ RAW 264.7 cells from different passages and grown in the presence of growth medium containing heat-inactivated (HI) or non-heat-inactivated serum (nHI) were plated and incubated overnight in 96-well plates in their respective growth medium. Cells were serum deprived for 1 hour in RAWAM (0% FBS) prior to stimulation with (A) prostaglandin E2 (PGE2, 10 M), or (B) isopreteronol (ISO 50nM), or control buffer. The reaction was stopped with 65% Ethanol at 0.33, 0.67, 1.5, 5, or 20 min. The amount of cyclic AMP in each sample is calculated as pmol/mg of protein. Aliquots of random samples are assayed for protein amounts. Results shown in the graphs are expressed as fold changes. Fold = cAMP of ligand- treated samples/cAMP of samples treated with medium alone. Each point represents the mean from duplicate samples assayed for each experiment at 40 seconds. Protocol ID=PP00000175 C Passage LPA • Acknowledgements Cell Preparation and Analysis Laboratory, Dallas, TX. Julie Collins, Richard Davis, Katherine Hawes, Jason Polasek, Amy Pope, Meghdad Rahdar, Melissa Stalder, Audra Wendt Antibody Laboratory, Dallas, TX. Eduardo Arteaga, Frank Amador, Rodrigo Ceja, Becky Fulin, Blythe King, Ruth Levitz, Ila Oxendine, Nick Wong, Biren Zhao Table 2. Summary of the ligands chosen for the ligand screen on RAW 264.7 cells. Results have been replicated at least 5 times. Red = increase, and Black = no change observed. Responses tested were changes in intracellular free calcium, cAMP accumulation, and changes in phosphosproteins using cocktail 1, which detects P-p90RSK (Thr381), P-Akt (Ser473), and P-Erk1 and P-Erk2 (Thr183/Tyr185) and P-Ribosomal S6 kinase, and cocktail 2, which detects P-Stat3 (Tyr 705), P-NF-kB (Ser536), P-p38Map kinase (Thr 183/Tyr 182), and P-JNK(L) and P-JNK(S) (Thr 183/Tyr 185). D Passage Ascites + g-anti mouse F(ab)’2 • From an initial list of 56 ligands, 25 were chosen to be used in the ligand screen • Different families of receptors are represented in this list of 25 ligands. • Robust changes in calcium, cAMP accumulation, and different kinetics of phosphorylation of Akt through receptors from different familes, illustrates the integrity and potential complexity of the signal transduction networks in RAW 264.7. • Time in culture does not change the responses to the selected ligands, except those through the FcR1 receptor which decays over time. This is not due to decrease in the expression levels of FcR1 (data not shown), but may be due to receptor desensitization. Further testing is ongoing. Due to the predictable loss of FcR1 response, all cultures are exchanged for new cultures at passage 15 to 20 prior to the loss. FcR1 response is monitored in all cultures weekly. • Results of the dual ligand screen are presented at the posters of Dr. K-M Lin. Passage Fig. 4Calculated fold changes in intracellular free [Ca2+] are stable over time except for FcgR1. Changes in intracellular free [Ca2+] in RAW 264.7 cells were monitored in different thaws of cells (December or January) over time. Changes in intracellular free [Ca2+] were measured using the Ca2+ indicator, Fluo-3 AM (3 M), and a Fluoroskan Ascent Microplate Fluorometer. Resting calcium was measured for 5 min, and then (A) C5a(250 nM), (B) UDP(25M), and (C) LPA (2.5M), or buffer was added at time 0. For FcgR1 responses (D), cells were incubated with mouse ascites containing mouse IgG2a(20g/ml) for 30 minutes, the medium removed, fresh medium added, and basal fluorescence measured for 5 min. Goat anti-mouse F(ab)’2(5 g/ml ) was added at time 0. All post ligand measurements were recorded for 10 minutes followed by sequential addition of ionomycin/thapsigargin/EGTA to obtain fluorescence minimum values. Calcium chloride was added to obtain fluorescence maximum values. Intracellular free [Ca2+] was calculated using the equation: [free Ca2+] = Kd (F - Fmin)/(Fmax - F). The Kd for Fluo-3 was assumed to be 390 nM. Different colored dots in each graph represent peak fold changes. Protocol ID=PP00000176 Table 3. Chromosome numbers were determined in AfCS RAW 264.7 cells derived from 2 different thaws but from the same freeze and from RAW cells received as a kind gift from Dr. K. Smith. AfCS cells were obtained from the American Type Tissue Culture Collection (ATCC) (item TIB-71; lot no. 2263775). Cytogenetic analysis was performed by Applied Genetics Laboratories, Inc., Melbourne, FLA (www.appliedgenetics.com) Table 1. Summary of the ligands tested on RAW 264.7 cells. All ligands were tested using 3 different concentrations (0.1X, 1.0X, and 10X) in the respective assays. White = not tested, Red = increase, and Black = no change observed. Responses tested were changes in intracellular free calcium, cAMP accumulation, and changes in phosphosproteins using cocktail 1, which detects P-p90RSK (Thr381), P-Akt (Ser473), P-Erk1 and P-Erk2 (Thr183/Tyr185) and P-Ribosomal S6 kinase, and cocktail 2, which detects P-Stat3 (Tyr 705), P-NF-B (Ser536), P-p38Map kinase (Thr 183/Tyr 182), and P-JNK(L) and P-JNK(S) (Thr 183/Tyr 185). Identification Of Ligands for the AfCS Ligand Screen and the Stability of Responses In RAW 264.7 Robert C.Hsueh, Heping Han, and Keng-Mean Lin Staffs at the Alliance for Cellular Signaling, Cell Preparation and Analysis lab, and Antibody Lab • Examples of RAW 264.7 Responses • Summary of Ligand Lists and Responses IV. The Stability of Responses in RAW 264.7 over time Initial Ligand List and Responses Final Ligand List and Responses Calcium Responses are Stable Except FcgR1 cAMP Responses are Stable Chromosomes Are Stable in Cultured Cells • Summary