Download
1 / 2
20 likes | 122 Views
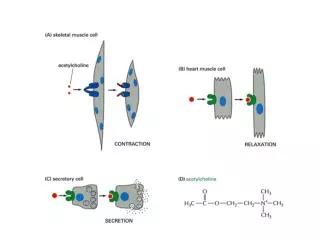
Multiplexed Glycerophospholipid Analysis of AfCS Ligand Screen Stephen B. Milne, Jeffrey S. Forrester, Pavlina T. Ivanova, Michelle D. Armstrong and H. Alex Brown AfCS Lipidomics Lab, Department of Pharmacology & VICB, Vanderbilt University Medical Center. Introduction.

E N D
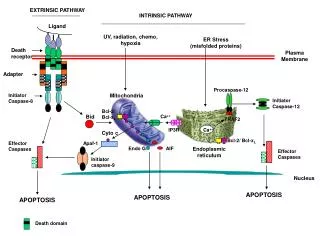
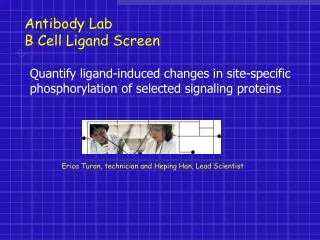
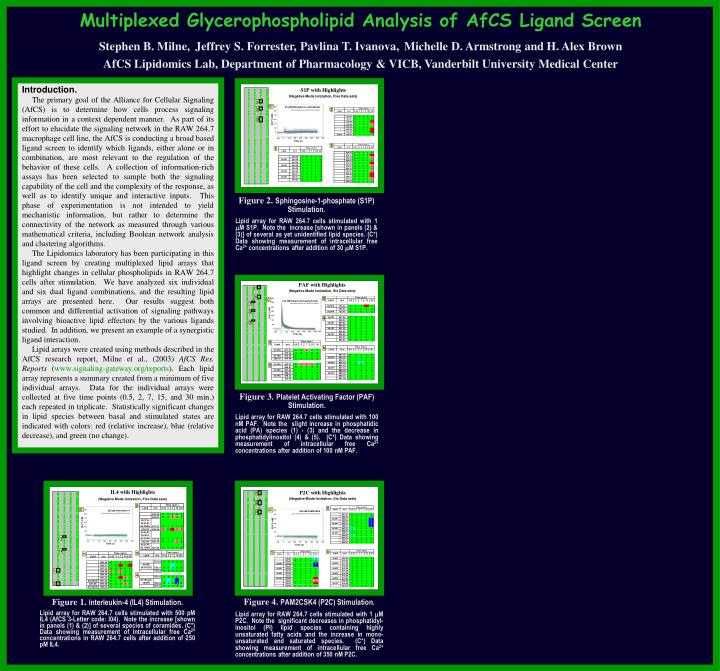
Multiplexed Glycerophospholipid Analysis of AfCS Ligand Screen Stephen B. Milne,Jeffrey S. Forrester,Pavlina T. Ivanova,Michelle D. Armstrong and H. Alex Brown AfCS Lipidomics Lab, Department of Pharmacology & VICB, Vanderbilt University Medical Center Introduction. The primary goal of the Alliance for Cellular Signaling (AfCS) is to determine how cells process signaling information in a context dependent manner. As part of its effort to elucidate the signaling network in the RAW 264.7 macrophage cell line, the AfCS is conducting a broad based ligand screen to identify which ligands, either alone or in combination, are most relevant to the regulation of the behavior of these cells. A collection of information-rich assays has been selected to sample both the signaling capability of the cell and the complexity of the response, as well as to identify unique and interactive inputs. This phase of experimentation is not intended to yield mechanistic information, but rather to determine the connectivity of the network as measured through various mathematical criteria, including Boolean network analysis and clustering algorithms. The Lipidomics laboratory has been participating in this ligand screen by creating multiplexed lipid arrays that highlight changes in cellular phospholipids in RAW 264.7 cells after stimulation. We have analyzed six individual and six dual ligand combinations, and the resulting lipid arrays are presented here. Our results suggest both common and differential activation of signaling pathways involving bioactive lipid effectors by the various ligands studied. In addition, we present an example of a synergistic ligand interaction. Lipid arrays were created using methods described in the AfCS research report, Milne et al., (2003) AfCS Res. Reports (www.signaling-gateway.org/reports). Each lipid array represents a summary created from a minimum of five individual arrays. Data for the individual arrays were collected at five time points (0.5, 2, 7, 15, and 30 min.) each repeated in triplicate. Statistically significant changes in lipid species between basal and stimulated states are indicated with colors: red (relative increase), blue (relative decrease), and green (no change). Figure 2. Sphingosine-1-phosphate (S1P) Stimulation. Lipid array for RAW 264.7 cells stimulated with 1 mM S1P. Note the increase [shown in panels (2) & (3)] of several as yet unidentified lipid species. (C*) Data showing measurement of intracellular free Ca2+ concentrations after addition of 30 mM S1P. Figure 3. Platelet Activating Factor (PAF) Stimulation. Lipid array for RAW 264.7 cells stimulated with 100 nM PAF. Note the slight increase in phosphatidic acid (PA) species (1) - (3) and the decrease in phosphatidylinositol (4) & (5). (C*) Data showing measurement of intracellular free Ca2+ concentrations after addition of 100 nM PAF. Figure 4. PAM2CSK4 (P2C) Stimulation. Lipid array for RAW 264.7 cells stimulated with 1 mM P2C. Note the significant decreases in phosphatidyl-inositol (PI) lipid species containing highly unsaturated fatty acids and the increase in mono- unsaturated and saturated species. (C*) Data showing measurement of intracellular free Ca2+ concentrations after addition of 350 nM P2C. Figure 1. Interleukin-4 (IL4) Stimulation. Lipid array for RAW 264.7 cells stimulated with 500 pM IL4 (AfCS 3-Letter code: I04). Note the increase [shown in panels (1) & (2)] of several species of ceramides. (C*) Data showing measurement of intracellular free Ca2+ concentrations in RAW 264.7 cells after addition of 250 pM IL4. Table 1. Results of RAW 264.7 Stimulation Table 1. Results of RAW 264.7 Stimulation Table 1. Results of RAW 264.7 Stimulation Table 1. Results of RAW 264.7 Stimulation
Multiplexed Glycerophospholipid Analysis of AfCS Ligand Screen Stephen B. Milne,Jeffrey S. Forrester,Pavlina T. Ivanova,Michelle D. Armstrong and H. Alex Brown AfCS Lipidomics Lab, Department of Pharmacology & VICB, Vanderbilt University Medical Center Figure 5. Stimulation with PAM2CSK4 (P2C) and Platelet Activating Factor (PAF). Lipid array for RAW 264.7 cells stimulated simultaneously with 1 mM P2C and 100 nM PAF. Note that combining P2C with PAF increases phosphatidic acid (3) - (4) compared to PAF alone (P2C has no PA response on its own.) The phosphatidylinositol (PI) response (5) & (6) in the dual ligand stimulated cells is similar to the P2C alone response. Figure 8. Comparison of phosphatidic acid (PA) and lysophosphatidic acid (LPA) responses in stimulated RAW 264.7 cells. The ligands UDP and PAF both produce several species of phosphatidic acid, while P2C fails to elicit this effect. LPA generation was not observed in any of the single ligand treatments, even where PA content increased. Only the combination of P2C and PAF produces LPA. Discussion. This portion of the AfCS ligand screen has demonstrated the ability of the Lipid Arrays to measure a broad spectrum of lipid effectors in RAW 264.7 cells after stimulation. Of the six ligands studied, four (LPA, IL4, S1P & P2C) produced unique patterns, while two (LPS and IFG) produced no changes over the time course studied. In addition, the Lipid Arrays identified at least one ligand combination (PAF and P2C) that produced an interaction in the signaling pathways. Many of the lipid effectors measured by the Lipid Arrays are ready for incorporation into the Boolean Network analysis as nodes, similar to the Ca2+ and cAMP data sets. Moreover, development of appropriate metrics would allow Lipid Arrays to take part in cluster analysis algorithms. Figure 6. Stimulation with PAM2CSK4 (P2C) and Platelet Activating Factor (PAF). Lipid array for RAW 264.7 cells stimulated simultaneously with 1 mM P2C and 100 nM PAF. (1) Note the strong interaction in the effects of these two ligands on the 40:6 and 40:7 phosphatidylcholine (PC) species as compared with the single ligand responses. Acknowledgments. The authors would like to thank the AfCS Cell Preparation Lab in Dallas, in particular Dianne Decamp. In addition, thanks to Andrew Goodman for excellent technical assistance. Figure 7. Stimulation with PAM2CSK4 (P2C) and Interferon-gamma (IFG). Lipid array for RAW 264.7 cells stimulated simultaneously with 1 mM P2C and 5 nM IFG. Note the increase in PA (1) – (4), and a decrease in PI (5) & (6). http://www.signaling-gateway.org Table 1. Results of RAW 264.7 Stimulation Table 1. Results of RAW 264.7 Stimulation Table 1. Results of RAW 264.7 Stimulation Table 1. Results of RAW 264.7 Stimulation