Download
1 / 1
10 likes | 99 Views
Lipidomic Profiling of RAW 264.7 Macrophages: The FXM Project Jeffrey S. Forrester, Stephen B. Milne, Pavlina T. Ivanova, Michelle D. Armstrong and H. Alex Brown AfCS Lipidomics Lab, Department of Pharmacology & VICB, Vanderbilt University Medical Center. Introduction.

E N D
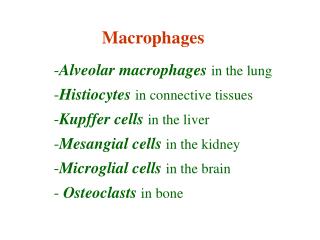
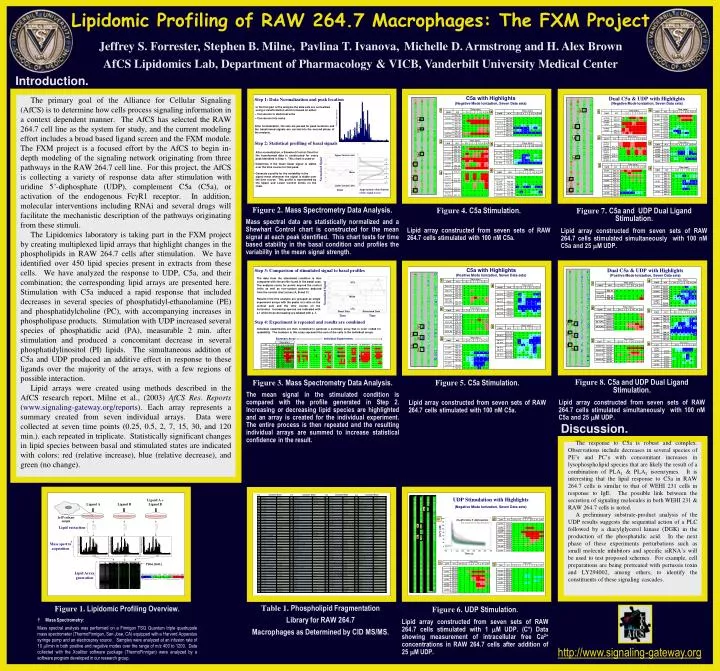
Lipidomic Profiling of RAW 264.7 Macrophages: The FXM Project Jeffrey S. Forrester,Stephen B. Milne,Pavlina T. Ivanova,Michelle D. Armstrong and H. Alex Brown AfCS Lipidomics Lab, Department of Pharmacology & VICB, Vanderbilt University Medical Center Introduction. The primary goal of the Alliance for Cellular Signaling (AfCS) is to determine how cells process signaling information in a context dependent manner. The AfCS has selected the RAW 264.7 cell line as the system for study, and the current modeling effort includes a broad based ligand screen and the FXM module. The FXM project is a focused effort by the AfCS to begin in-depth modeling of the signaling network originating from three pathways in the RAW 264.7 cell line. For this project, the AfCS is collecting a variety of response data after stimulation with uridine 5’-diphosphate (UDP), complement C5a (C5a), or activation of the endogenous FcgR1 receptor. In addition, molecular interventions including RNAi and several drugs will facilitate the mechanistic description of the pathways originating from these stimuli. The Lipidomics laboratory is taking part in the FXM project by creating multiplexed lipid arrays that highlight changes in the phospholipids in RAW 264.7 cells after stimulation. We have identified over 450 lipid species present in extracts from these cells. We have analyzed the response to UDP, C5a, and their combination; the corresponding lipid arrays are presented here. Stimulation with C5a induced a rapid response that included decreases in several species of phosphatidyl-ethanolamine (PE) and phosphatidylcholine (PC), with accompanying increases in phospholipase products. Stimulation with UDP increased several species of phosphatidic acid (PA), measurable 2 min. after stimulation and produced a concomitant decrease in several phosphatidylinositol (PI) lipids. The simultaneous addition of C5a and UDP produced an additive effect in response to these ligands over the majority of the arrays, with a few regions of possible interaction. Lipid arrays were created using methods described in the AfCS research report, Milne et al., (2003) AfCS Res. Reports (www.signaling-gateway.org/reports). Each array represents a summary created from seven individual arrays. Data were collected at seven time points (0.25, 0.5, 2, 7, 15, 30, and 120 min.). each repeated in triplicate. Statistically significant changes in lipid species between basal and stimulated states are indicated with colors: red (relative increase), blue (relative decrease), and green (no change). Introduction: Figure 7. C5a and UDP Dual Ligand Stimulation. Lipid array constructed from seven sets of RAW 264.7 cells stimulated simultaneously with 100 nM C5a and 25 mM UDP. Figure 4. C5a Stimulation. Lipid array constructed from seven sets of RAW 264.7 cells stimulated with 100 nM C5a. Figure 2. Mass SpectrometryData Analysis. Mass spectral data are statistically normalized and a Shewhart Control chart is constructed for the mean signal at each peak identified. This chart tests for time based stability in the basal condition and profiles the variability in the mean signal strength. Figure 8. C5a and UDP Dual Ligand Stimulation. Lipid array constructed from seven sets of RAW 264.7 cells stimulated simultaneously with 100 nM C5a and 25 mM UDP. Figure 5. C5a Stimulation. Lipid array constructed from seven sets of RAW 264.7 cells stimulated with 100 nM C5a. Figure 3. Mass SpectrometryData Analysis. The mean signal in the stimulated condition is compared with the profile generated in Step 2. Increasing or decreasing lipid species are highlighted and an array is created for the individual experiment. The entire process is then repeated and the resulting individual arrays are summed to increase statistical confidence in the result. Discussion. The response to C5a is robust and complex. Observations include decreases in several species of PE’s and PC’s with concomitant increases in lysophospholipid species that are likely the result of a combination of PLA1 & PLA2 isoenzymes. It is interesting that the lipid response to C5a in RAW 264.7 cells is similar to that of WEHI 231 cells in response to IgE. The possible link between the secretion of signaling molecules in both WEHI 231 & RAW 264.7 cells is noted. A preliminary substrate-product analysis of the UDP results suggests the sequential action of a PLC followed by a diacylglycerol kinase (DGK) in the production of the phosphatidic acid. In the next phase of these experiments perturbations such as small molecule inhibitors and specific siRNA’s will be used to test proposed schemes. For example, cell preparations are being pretreated with pertussis toxin and LY294002, among others, to identify the constituents of these signaling cascades. Table 1. Phospholipid Fragmentation Library for RAW 264.7 Macrophages as Determined by CID MS/MS. Figure 1. Lipidomic Profiling Overview. †Mass Spectrometry: Mass spectral analysis was performed on a Finnigan TSQ Quantum triple quadrupole mass spectrometer (ThermoFinnigan, San Jose, CA) equipped with a Harvard Apparatus syringe pump and an electrospray source. Samples were analyzed at an infusion rate of 10 ml/min in both positive and negative modes over the range of m/z 400 to 1200. Data collected with the Xcalibur software package (ThermoFinnigan) were analyzed by a software program developed in our research group. Figure 6. UDP Stimulation. Lipid array constructed from seven sets of RAW 264.7 cells stimulated with 1 mM UDP. (C*) Data showing measurement of intracellular free Ca2+ concentrations in RAW 264.7 cells after addition of 25 mM UDP. http://www.signaling-gateway.org Table 1. Results of RAW 264.7 Stimulation Table 1. Results of RAW 264.7 Stimulation Table 1. Results of RAW 264.7 Stimulation Table 1. Results of RAW 264.7 Stimulation