Download
1 / 83
850 likes | 1.08k Views
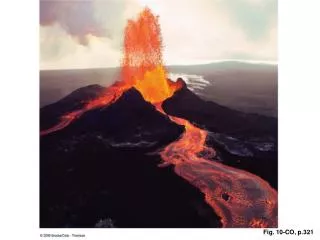
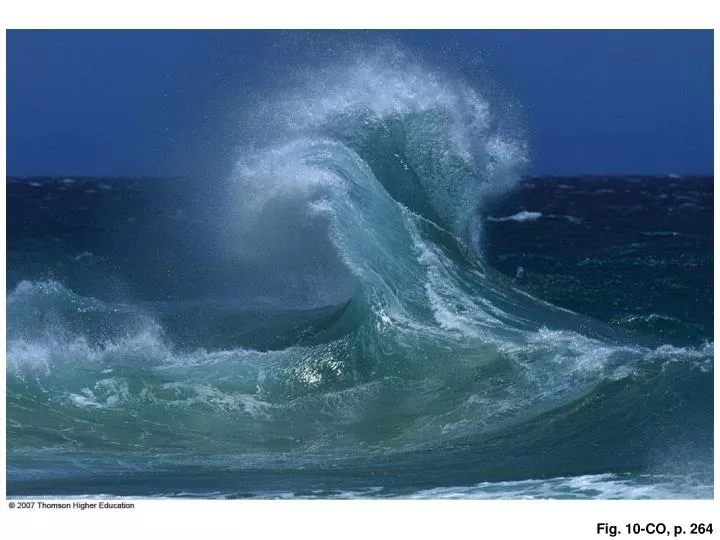
Fig. 10-CO, p. 264. Fig. 10-1, p. 266. Wave direction. Wave. Fig. 10-1, p. 266. Wave. Wave direction. Stepped Art. Fig. 10-1, p. 266. Fig. 10-2, p. 266. Direction of wave motion. A. B. Wavelength. Height. Still water level. Trough. Crest.

E N D
Wave direction Wave Fig. 10-1, p. 266
Wave Wave direction Stepped Art Fig. 10-1, p. 266
Direction of wave motion A B Wavelength Height Still water level Trough Crest Frequency: Number of wave crests passing point A or point B each second Orbital path of individual water molecule at water surface Period: Time required for wave crest at point A to reach point B Fig. 10-2, p. 266
Direction of wave motion Wave-length Still water level Crest Crest Trough 1/2 wave-length depth Fig. 10-3, p. 267
Stokes drift (mass transport) No mass transport Wave Wave Closed orbit after one period Open orbit after one period Fig. 10-4, p. 267
Seismic disruption Disturbing force Gravity Wind landslides Surface tension Gravity Restoring force Tide Tsunami Seiche Wind wave Capillary wave (ripple) Type of wave 24 hr. 12 hr. Amount of energy in ocean surface 100,000 sec (1 1/4 days) 10,000 sec (3 hr) 1,000 sec (17 min) 100 sec 10 sec 1 sec 1/10 sec 1/100 sec 1 10 100 Period (time, in seconds for two successive wave crests to pass a fixed point) Frequency (waves per second) Fig. 10-5, p. 269
Wavelength (m) 0 100 200 300 400 500 600 30.6 27.8 17 62 18 15 25.0 16 50 13 22.2 11 14 19.4 12 37 Speed (mph) Period (in seconds) 16.6 9 Speed (m/sec) 10 13.8 7 25 11.0 8 5 6 8.4 3 4 13 5.6 2 2.8 1 0 0.0 0 328 656 984 1,312 1,640 1,968 Wavelength (ft) Fig. 10-7, p. 270
Wind b Sea surface a Maximum wavelength 1.73 cm (0.68 in.) Fig. 10-8, p. 271
5 4 3 2 1 6 5 4 3 2 1 6 5 4 3 2 7 6 5 4 3 7 6 5 4 3 7 6 5 4 8 7 6 5 8 7 6 5 Fig. 10-10, p. 272
5 4 3 2 1 6 5 4 3 2 1 6 5 4 3 2 7 6 5 4 3 7 6 5 4 3 7 6 5 4 8 7 6 5 8 7 6 5 Stepped Art Fig. 10-10, p. 272
Changing to swell Fully developed seas Ripples to chop to wind waves Direction of wave advance Wind Length of fetch Fig. 10-11, p. 273
7 across 1 high 120° Fig. 10-14, p. 275
1 2 a b Constructive interference (addition) Destructive interference (subtraction) Constructive interference (addition) Fig. 10-15, p. 275
2 1 5 4 3 Depth = 1/2 wavelength Surf zone Fig. 10-17, p. 277
Direction of progress Wave crests Waves begin to "feel bottom" here, water depth is L/2. Bottom contours Shoreline Fig. 10-19a, p. 279
Waves A and B create a checkerboard of peaks and troughs A B Fig. 10-20b, p. 280
0 (Every tenth wave crest shown) Waves moving 10 20 30 Islands Areas of wave crest reinforcement due to diffraction and interference Fig. 10-22, p. 280
Node Node Node Crest Crest Maximum water flow Trough No motion No motion 2 3 1 Fig. 10-23a, p. 281
Node Node Crest Trough Trough No motion Maximum water flow 4 5 Starts again at 2 Fig. 10-23b, p. 281