Download
1 / 64
640 likes | 811 Views
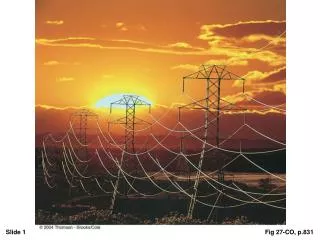
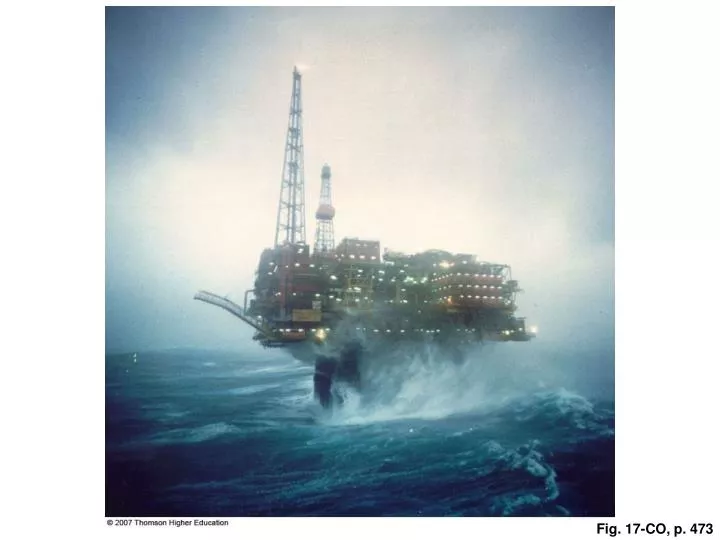
Fig. 17-CO, p. 473. Fig. 17-1, p. 475. Fig. 17-2, p. 476. 250. History. Projections. Oil. Coal. 200. Natural Gas. Renewables. Nuclear. 150. Quadrillion Btu. 100. 50. 0. 1970. 1980. 1900. 2001. 2010. 2025. Year. Fig. 17-2, p. 476. Fig. 17-3a, p. 476. Salt.

E N D
250 History Projections Oil Coal 200 Natural Gas Renewables Nuclear 150 Quadrillion Btu 100 50 0 1970 1980 1900 2001 2010 2025 Year Fig. 17-2, p. 476
Salt Fig. 17-3a, p. 476
Well Seafloor Seal Gas Reservoir rock containing oil and dissolved gas Fig. 17-3b, p. 476
Power modules “Pelamis” wave energy converter The Pelamis machine, 492 feet long with an 11.5-foot diameter, is composed of three power conversion modules connected by weighted tubes. Heave Side view How it works Power module Hydraulic ram The motion caused by a wave swell is resisted by hydraulic rams Heaving and swaying Sway Top view Power conversion module Sway Heave Converting the Motion Hydraulic ram Gen-erator Power module Motor Hydraulic rams Collection chamber Joints on the opposite side of the power module allow for a perpendicular sway motion Hydraulic rams pump high-pressure fluid into chambers that feed the fluid to a motor. The motor drives a generator to create electricity. Fig. 17-10b, p. 483
Heat exchanger (ammonia evaporator) Warm, shallow seawater Pressurized ammonia vapor Turbine generator Pump Electric power Liquid ammonia Heat exchanger (ammonia condenser) Cold, deep seawater Fig. 17-12a, p. 485
Heat exchanger (ammonia evaporator) Warm, shallow seawater Pressurized ammonia vapor Turbine generator Pump Electric power Liquid ammonia Heat exchanger (ammonia condenser) Cold, deep seawater Stepped Art Fig. 17-12a, p. 485
Arctic Ocean Russia Northeast Atlantic Russia North America Asia Northwest Pacific Europe United States North Pacific Ocean Asia China Japan North Atlantic Ocean Africa Western Central Pacific Indian Ocean Peru Fishing area boundary Southeast Pacific South Pacific Ocean Australia South America South Atlantic Ocean Antarctica Top five harvesters, 2004 (Live catch of fishes, crustaceans, and mollusks, in millions of metric tons) Top fishing areas, 2004 (live catch, in millions of metric tons) Southeast Pacific 21.6 China Northeast Atlantic 16.9 15.5 United States 11.0 10.0 9.6 Indonesia 5.0 4.9 4.8 Peru Chile Northwest Pacific Western Central Pacific Fig. 17-13a, p. 486
140 China 120 World excluding China 100 80 Million metric tons 60 40 20 0 50 58 74 78 94 66 70 54 62 82 86 90 98 02 Year b Fig. 17-13b, p. 486
Mid-water trawl net a Fig. 17-17a, p. 488
20 44.1 15 33.075 Average per capita catch (lb) Average per capita catch (kg) 22.05 10 5 11.025 0 0 1950 1960 1970 1980 1990 2000 Year Fig. 17-18, p. 488
Tons of fish per km2 10+ 8–9 6–7 4–5 3–4 0–2 1900 Fig. 17-19a, p. 489
Tons of fish per km2 10+ 8–9 6–7 4–5 3–4 0–2 1950 Fig. 17-19b, p. 489
Tons of fish per km2 10+ 8–9 6–7 4–5 3–4 0–2 1999 Fig. 17-19c, p. 489
30 25 Fin whale 20 Sperm whale Thousands of whales caught 15 Sei whale 10 Blue whale 5 Humpback whale 0 1945 1950 1955 1960 1965 1970 1975 1980 1985 Year Fig. 17-25, p. 492