Download
1 / 18
180 likes | 310 Views
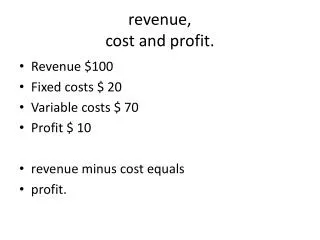
Team Cost, Profit and Winning. Here we start with definitions and then look at idea of how a sports owner might run the team. Profit. Profit is defined as total revenue (TR) minus total cost TC. You might see this written in shorthand as Π = TR – TC.

E N D
Team Cost, Profit and Winning Here we start with definitions and then look at idea of how a sports owner might run the team.
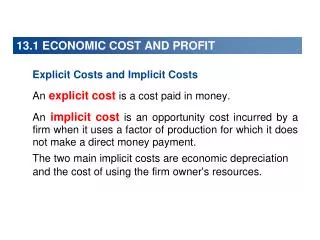
Profit Profit is defined as total revenue (TR) minus total cost TC. You might see this written in shorthand as Π = TR – TC. In economics the is a profit maximum hypothesis that suggests owners make decisions with the goal to have maximum profit. What this means is if there are 2 (or more) scenarios the owner will pick the scenario with the highest profit. Let’s note the public will typically only see the scenario the owner has actually taken, but not all the alternatives. Then, sometimes what we see seems like owner didn’t maximize profit.
Winning Percentage Winning percentage for a team is defined asgames won divided by the total games played. The author will use the phrase TEAM QUALITY as a synonym for winning percentage W. Also, sometimes W will by the definition above multiplied by 1000. Example: in a past year the Chicago Bulls won 72 of 82 games for a W = 72/82 = .88 or 880. The author tells us that sports teams produce winning or quality. Bakeries make donuts, sports teams make wins! Let’s remember things like athletic prowess, commonality, absolute performance and relative performance all correlate with winning (go hand in hand with).
Short Run/Long Run In economics we typically think about resources as being either fixed or variable. A variable input is a resource that at any time can be changed in amount. A fixed input is a resource that for a least some amount of time can not be changed in amount. The short run is a time frame where some inputs might be variable, but at least one input is fixed in amount. The long run is that time frame where all inputs can be varied. When cost of production is analyzed, the time frame is noted. In the short run total cost (SRTC) equals the short run fixed cost (TFC) plus the short run variable cost (TVC). In the long run we just refer to total cost.
Short Run/Long Run The primary FIXED inputs are talent, on and off the field, and the facility in which the team plays. In the short run the owner makes decisions about the number of tickets to sell and the price to charge and maybe the number of games to put on local TV. All of these decisions assume the quality of the team is fixed. In the sports context the short run is a period of time when team quality is held constant. In the long run the stadium can change, coaches and management can be replaced and the lineup may be completely altered – these all have an impact on quality.
SR Production and Cost We look at inputs to winning, see how much winning occurs and look at the price of inputs to determine the cost of winning. The following fixed inputs contribute to TFC: Player roster The stadium Other contractual personnel like the GM, managers and coaches Insurance Loans Obligations to league. The variable inputs contribute to TVC: Entertainment between innings/during time outs Scouting and player development Advertising and marketing Labor to sell tickets, parking, concessions, ushers and clean-up. In sports the TFC can be over 50% of the STRC
Example – making cookies Fixed input Variable input cookie units TFC TVC SRTC Capital labor output 1 0 0 100 0 100 1 1 10 100 10 110 1 2 21 100 20 120 1 3 33 100 30 130 1 4 43 100 40 140 1 5 50 100 50 150 1 6 55 100 60 160 Here we have 1 oven and when labor is added we get more cookies made per unit of time – this is all occurring in, let’s say, 1 hour. If 5 workers work in 1 hour 50 cookies are made. The oven has a cost of $100 per hour and each worker gets paid $10.
Graph idea SRTC TVC $ costs Note that TVC is always rising, but at first the rise is at a decreasing rate, but then the rise is at an increasing rate. The rate becomes increasing because of the diminishing returns to the variable input with the fixed input. TFC Cookies The difference between the SRTC and TVC is the TFC. Higher TFC means higher SRTC
Sports in SR If you look at the graph on the previous screen and make the X axis the attendance at games (which is correlated with winning) then the curves are similar in the sports world. When the team is of a certain quality, adding entertainment during time outs, for example, might increase attendance. But the entertainment during time outs is a small part of the time at the game. At some point additional attendance from the time out entertainment could only be obtained with a large increase in cost. You would have to have really good entertainment.
Long Run – production of winning or quality The main idea presented is that the more stars there are on a team the higher will be the quality of the team. So, winning is produced by stars. Adding a few stars when the team has none has a great impact on the winning, but at some point adding even more stars will increase winning, but the rate of increase in winning will slow down. In the long run when the team adds stars the winning percent increase slows down because it is thought that the management function is limited and can not effectively deal with a large amount of stars. So, at some point adding a star does not add as much to the winning percent. Winning percent # of stars
Long Run Cost Cost $ Here we see winning can be increased, but eventually the costs begin to rise rapidly due to the same thing we saw before. The management function has a difficult time handling all the stars. Total Team Salary Cost + other costs Relatively large Relatively small increment to cost Winning % Equal increments to winning.
Connecting short run and long run On the previous slide we have winning % on the horizontal axis. Once a level of winning percentage is picked (by going after the appropriate number of star players) we have a short run situation. Back on slide 8 we have one short run situation. The connection between the short run and the long run is that the greater the number of star players purchased in the long run, the higher the cost in the long run. This means in the short run there will be higher fixed costs and the SRTC is thus higher. In other words, with 5 star players, for example, the SRTC is higher than it would be if there were just 4 star players.
Profit in the SR An owner may be dissatisfied with this range of profit and decide to dump talent. This would have the impact of lowering SRTC (which really is a long run idea – to which we turn next) $ SRTC TR A Range of attendance where profit is positive. Quality of team is fixed. In this example revenue max is at an attendance level above the profitable range. Owner won’t go to revenue max point.
Profit in the LR In economics we often say that the long run is simply a series of short run situations. Recall that Profit = TR – TC = TR – SRTC in the short run. Also recall the short run is the time frame in which quality is held constant. Since player salary is the major part of SRTC and is a fixed cost, the more stars on the team the higher the fixed cost and SRTC. SO, each number of stars on a team sets a quality of team and results in a different SRTC. On slide 13 if you took the whole SRTC and moved it you would really be talking about a different quality team. You can see if the SRTC shifted up a lot because of a team deciding to get a high quality team, then maybe the profit is a negative number.
Profit in the LR The story on the previous slide is incomplete. The reason is that when the owner decides to have a higher quality team the TR also shifts up (and moves a little to the right). The TR shifting up increases the range of attendance that would give profit. So, we have a couple of things to think about when the owner of a team attempts to change team quality. Both TR and TC change. The way it is thought to play out is what we see on the next slide. The idea is that when quality is really low and an attempt is made to increase it TR will grow more than TC will grow and profit will rise. But, at some point, increasing quality will have TR increase by less than TC increases and thus profit will begin to fall.
Profit in LR $ π* π1 1.000 Q1 Q* Quality or winning %
Profit in LR Let’s note some things about the previous slide 1) The graph is of profit and not just TR. 2) Each quality level has a graph similar to slide 13 representing it. 3) The profit is maximized in the graph with quality level Q* because it has the highest profit level π*. 4) Different teams will have a different profit function but will have the general shape as the one shown.
Profit in the LR Conclusions 1) Profits can constrain winning – the profit max level for some owners will be at a low Q – either they are high cost owners and/or the market for the team is low revenue, 2) Profits can influence competitive balance – If only a few teams have relatively high revenue and low cost operations, then the few will have high winning %’s and the rest will be low winning percentage teams. Caution – you are about to enter a no spin zone! Now, some years high winning % teams will have injuries and other bad luck which will make them look bad. But over the long haul they will win more games! 3) A small market is only a problem if it can only generate a small revenue (Is Green Bay a problem market?).