Download
1 / 22
220 likes | 409 Views
Contingency Tables: Tests for independence and homogeneity ( § 10.5). How to test hypotheses of independence (association) and homogeneity (similarity) for general two-way cross classifications of count data. Terms: Contingency Table Cross-Classification Table Measure of association.

E N D
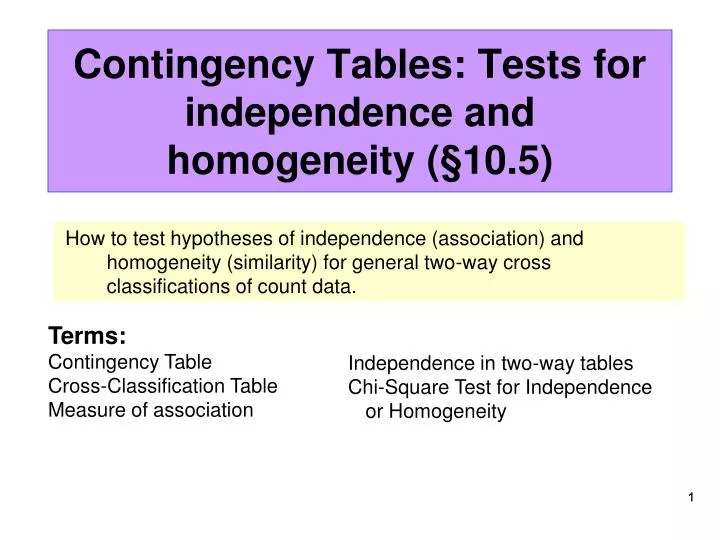
Contingency Tables:Tests for independence and homogeneity (§10.5) How to test hypotheses of independence (association) and homogeneity (similarity) for general two-way cross classifications of count data. Terms: Contingency Table Cross-Classification Table Measure of association Independence in two-way tables Chi-Square Test for Independence or Homogeneity
Test of Independence or Association A university conducted a study concerning faculty teaching evaluation classification by students. A sample of 467 faculty is randomly selected, and each person is classified according to rank (Instructor, Assistant Professor, etc. ) and teaching evaluation (Above, Average, Below). Data can be formatted into a cross-tabulation or contingency table. Each person has two categorical responses.
What are we interested in from this two-way classification table? Is the level of teaching evaluation related to rank? Are Professors more likely to be judged above average than other ranks? Ho: Teaching Evaluation and Rank are independent variables. Two variables that have been categorized in a two-way table areindependentif the probability that a measurement is classified into a given cell of the table is equal to the probability of being classified into that row times the probability of being classified into that column. This must be true for all cells of the table.
Test Statistic: df = (r-1)(c-1) r=#rows=3, c=#cols=4, 3 ´4 table. The independence assumption: Observed Expected
Expected Counts Assumptions: no Eij< 1, and no more than 20% of Eij< 5.
Individual Cell Chi Square Values Reject Ho There is evidence of an association between rank and evaluation. Note that we observed less Assistant Professors getting below average evaluations (13)than we would expect under independence (26.2). Chi Square value is 6.67.
Minitab rank eval count 1 1 30 1 2 48 1 3 36 2 1 13 2 2 50 2 3 62 3 1 20 3 2 35 3 3 45 4 1 35 4 2 43 4 3 50 STAT > TABLES > Cross Tabs Classification Variables: rank eval Check Chi-square Analysis, and Above and Std. residual Frequencies are in: count Input data in this way
Tabulated Statistics: eval, rank Rows: eval Columns: rank 1 2 3 4 All 1 30 13 20 35 98 23.92 26.23 20.99 26.86 98.00 1.24 -2.58 -0.22 1.57 -- 2 48 50 35 43 176 42.96 47.11 37.69 48.24 176.00 0.77 0.42 -0.44 -0.75 -- 3 36 62 45 50 193 47.11 51.66 41.33 52.90 193.00 -1.62 1.44 0.57 -0.40 -- All 114 125 100 128 467 114.00 125.00 100.00 128.00 467.00 -- -- -- -- -- Chi-Square = 17.435, DF = 6, P-Value = 0.008 Cell Contents -- Count Exp Freq Std. Resid Square roots of Individual Chi-square values:
options ls=79 ps=40 nocenter; data eval; input job $ rating $ number; datalines; Instructor Above 36 Instructor Average 48 Instructor Below 30 Assistant Above 62 Assistant Average 50 Assistant Below 13 Associate Above 45 Associate Average 35 Associate Below 20 Professor Above 50 Professor Average 43 Professor Below 35 ; run; procfreqdata=eval; weight number; table job*rating / chisq ; run; Table of job by rating job rating Frequency‚ Percent ‚ Row Pct ‚ Col Pct ‚Above ‚Average ‚Below ‚ Total ƒƒƒƒƒƒƒƒƒˆƒƒƒƒƒƒƒƒˆƒƒƒƒƒƒƒƒˆƒƒƒƒƒƒƒƒˆ Assistan ‚ 62 ‚ 50 ‚ 13 ‚ 125 ‚ 13.28 ‚ 10.71 ‚ 2.78 ‚ 26.77 ‚ 49.60 ‚ 40.00 ‚ 10.40 ‚ ‚ 32.12 ‚ 28.41 ‚ 13.27 ‚ ƒƒƒƒƒƒƒƒƒˆƒƒƒƒƒƒƒƒˆƒƒƒƒƒƒƒƒˆƒƒƒƒƒƒƒƒˆ Associat ‚ 45 ‚ 35 ‚ 20 ‚ 100 ‚ 9.64 ‚ 7.49 ‚ 4.28 ‚ 21.41 ‚ 45.00 ‚ 35.00 ‚ 20.00 ‚ ‚ 23.32 ‚ 19.89 ‚ 20.41 ‚ ƒƒƒƒƒƒƒƒƒˆƒƒƒƒƒƒƒƒˆƒƒƒƒƒƒƒƒˆƒƒƒƒƒƒƒƒˆ Instruct ‚ 36 ‚ 48 ‚ 30 ‚ 114 ‚ 7.71 ‚ 10.28 ‚ 6.42 ‚ 24.41 ‚ 31.58 ‚ 42.11 ‚ 26.32 ‚ ‚ 18.65 ‚ 27.27 ‚ 30.61 ‚ ƒƒƒƒƒƒƒƒƒˆƒƒƒƒƒƒƒƒˆƒƒƒƒƒƒƒƒˆƒƒƒƒƒƒƒƒˆ Professo ‚ 50 ‚ 43 ‚ 35 ‚ 128 ‚ 10.71 ‚ 9.21 ‚ 7.49 ‚ 27.41 ‚ 39.06 ‚ 33.59 ‚ 27.34 ‚ ‚ 25.91 ‚ 24.43 ‚ 35.71 ‚ ƒƒƒƒƒƒƒƒƒˆƒƒƒƒƒƒƒƒˆƒƒƒƒƒƒƒƒˆƒƒƒƒƒƒƒƒˆ Total 193 176 98 467 41.33 37.69 20.99 100.00 SAS
The FREQ Procedure Statistics for Table of job by rating Statistic DF Value Prob ƒƒƒƒƒƒƒƒƒƒƒƒƒƒƒƒƒƒƒƒƒƒƒƒƒƒƒƒƒƒƒƒƒƒƒƒƒƒƒƒƒƒƒƒƒƒƒƒƒƒƒƒƒƒ Chi-Square 6 17.4354 0.0078 Likelihood Ratio Chi-Square 6 18.7430 0.0046 Mantel-Haenszel Chi-Square 1 10.8814 0.0010 Phi Coefficient 0.1932 Contingency Coefficient 0.1897 Cramer's V 0.1366 Sample Size = 467
First you need to tell SPSS that each observation must be weighted by the cell count. SPSS DATA > WEIGHT CASES Then you choose the analysis. ANALYZE > DESCRIPTIVE STATISTICS > CROSS TABS
R > score <- c(36,48,30,62,50,13,45,35,20,50,43,35) > mscore <- matrix(score,3,4) > mscore [,1] [,2] [,3] [,4] [1,] 36 62 45 50 [2,] 48 50 35 43 [3,] 30 13 20 35 > chisq.test(mscore) Pearson's Chi-squared test data: mscore X-squared = 17.4354, df = 6, p-value = 0.00781 > out <- chisq.test(mscore) > out[1:length(out)] $statistic X-squared 17.43537 $parameter df 6 $p.value [1] 0.00780959
$method [1] "Pearson's Chi-squared test" $data.name [1] "mscore" $observed [,1] [,2] [,3] [,4] [1,] 36 62 45 50 [2,] 48 50 35 43 [3,] 30 13 20 35 $expected [,1] [,2] [,3] [,4] [1,] 47.11349 51.65953 41.32762 52.89936 [2,] 42.96360 47.10921 37.68737 48.23983 [3,] 23.92291 26.23126 20.98501 26.86081 $residuals [,1] [,2] [,3] [,4] [1,] -1.6191155 1.4386830 0.5712511 -0.3986361 [2,] 0.7683695 0.4211764 -0.4377528 -0.7544218 [3,] 1.2424774 -2.5834003 -0.2150237 1.5704402 Square roots of Individual Chi-square values:
Test of Homogeneity Suppose we wish to determine if there is an association between a rare disease and another more common categorical variable (e.g. smoking). We can’t just take a random sample of subjects and hope to get enough cases (subjects with the disease). One solution is to choose a fixed number of cases, and a fixed number of controls, and classify each according to whether they are smokers or not. The same chi square test of independence applies here, but since we are sampling within subpopulations (have fixed margin totals), this is now called a chi square test of homogeneity (of distributions).
Homogeneity Null Hypothesis In general, if the column categories represent c distinct subpopulations, random samples of size n1, n2, …, nc are selected from each and classified into the r values of a categorical variable represented by the rows of the contingency table. The hypothesis of interest here is if there a difference in the distribution of subpopulation units among the r levels of the categorical variable, i.e. are the subpopulations homogenous or not. Subpop 1 = Subpop 2 = … = Subpop c 11 12 ... 1c 21 22 ... 2c : : : : r1 r2 ... rc ij = proportion of subpop j subjects (j=1,…,c) that fall in category i (i=1,…,r).
Example: Myocardial Infarction(MI) Data was collected to determine if there is an association between myocardial infarction and smoking in women. 262 women suffering from MI were classified according to whether they had ever smoked or not. Two controls (patients with other acute disorders) were matched to every case. Is the incidence of smoking the same for MI and non-MI sufferers? Ho: the incidence of MI is homogenous with respect to smoking Ho: 11=12 and 21=22
Example: MI results in MTB Stat -> Tables -> Chi-Square Test -------------------------------------------------------------------------------------------- Chi-Square Test: MI Yes, MI No Expected counts are printed below observed counts MI Yes MI No Total 1 172 173 345 115.74 229.26 2 90 346 436 146.26 289.74 Total 262 519 781 Chi-Sq = 27.352 + 13.808 + 21.643 + 10.926 = 73.729 DF = 1, P-Value = 0.000 Conclude: there is evidence of lack of homogeneity of incidence of MI with respect to smoking.
Odds and Odds Ratios • Sometimes probabilities are expressed as odds, e.g. • Gambling circles. (Why?) • Biomedical studies. (Easy interpretation in logistic regression, etc.) Odds of Event A = P(A) (1-P(A)) P(A) = Odds of A / (1 + Odds of A) Ex: A horse has odds of 3 to 2 of winning. This means that in every 3+2=5 races the horse wins 3 and loses 2. So P(Wins) = 3/5. To use the above formula express the odds as d to 1, so 1.5 to 1 in this case. Thus P(Wins) = 1.5 / (1+1.5) = 1.5 / 2.5 = 3/5.
Example: MI and Odds Ratios For women sufferers of MI, the proportion who ever smoked is 172/262 = 0.656. In other words, the odds that a woman MI sufferer is a smoker are 0.656/(1-0.656) = 1.9. For women non-sufferers of MI, the proportion who ever smoked is 173/519 = 0.333. In other words, the odds that a woman non-MI sufferer is a smoker are 0.333/(1-0.333) = 0.5. We can now calculate the odds ratio of being a smoker among MI sufferers: OR = 1.9/0.5 = 3.82 Among MI suffers,the odds of being a smoker are about 4 times the odds of not being a smoker. Put another way: a randomly selected MI sufferer is about twice as likely (.656/.333) of being a smoker than of not being one.