Download
1 / 22
220 likes | 363 Views
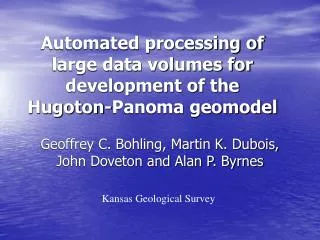
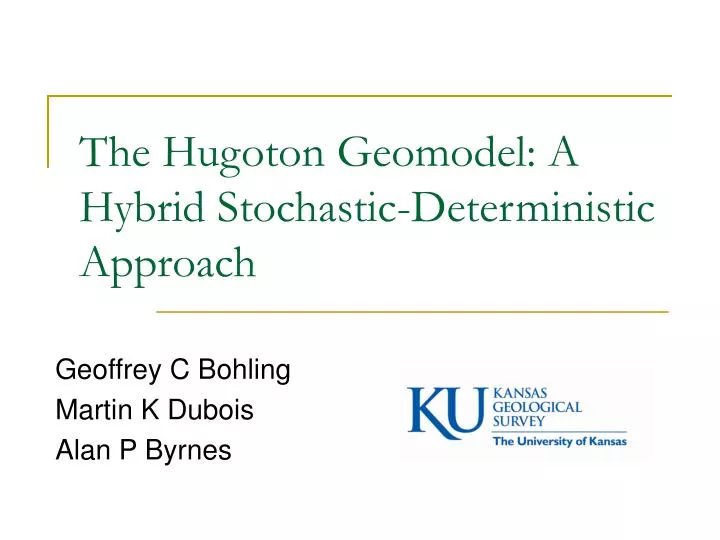
The Hugoton Geomodel: A Hybrid Stochastic-Deterministic Approach. Geoffrey C Bohling Martin K Dubois Alan P Byrnes. Miles. 103°. 102°. 10. 0. 10. 20. 30. 40. 50. Kilometers. 20. 0. 20. 40. 60. 80. 100. 38°. COLORADO. Legend. STUDY. Gas. productive. AREA. areas. KANSAS.

E N D
The Hugoton Geomodel: A Hybrid Stochastic-Deterministic Approach Geoffrey C Bohling Martin K Dubois Alan P Byrnes
Miles 103° 102° 10 0 10 20 30 40 50 Kilometers 20 0 20 40 60 80 100 38° COLORADO Legend STUDY Gas productive AREA areas KANSAS Oil productive area Major faults 37° OKLAHOMA TEXAS 36° Panhandle 35° Study Area Study Area and History Permian (Wolfcampian) • Largest gas field in North America. EUR 75 TCF (2.1 trillion m3) • 12,000 wells, 6200 mi2 (16,000 km2). 2.8 BCF per well. • Spacing: 2-3 wells per 640 acres • Discovered 1922, developed 1940-50s. • Maximum continuous gas column: 500 ft (165 m). • Shallow: Top 2100-2800 ft deep (640-850 m). • Initial wellhead SIP 437 psi (3013 kPa) • Dry gas, pressure depletion reservoir, stratigraphic trap gas and oil fields Byerly Bradshaw N Panoma 1500 0 Kansas 500 Hugoton 1000 1500 0 Guymon Hugoton 500 1000 Texas Hugoton -500 500 West 0 -1000 Panhandle Amarillo -1500 1000 500 1000 East Wichita 1000 - 500 500 0 0 Uplift 500 -500 500 -500 0 -1000 -500 Wolfcamp Structure (CI=500’) Bohling, Dubois, Byrnes (modified after Pippin, 1970, and Sorenson, 2005)
Stratigraphy Production from 13 fourth order marine-continental cycles. Shoaling upward carbonate cycles (reservoir) separated by redbed siltstones of poor reservoir quality. Bohling, Dubois, Byrnes
Basic Problem • Inability to compute saturations from logs due to deep filtrate invasion • Significant differences in permeability-porosity and capillary pressure relationships between facies • Prompts development of geomodel of entire field for property-based evaluations of volumetrics and flow • Supported by consortium of 10 companies Bohling, Dubois, Byrnes
Hugoton Geomodel • 108-million cell Petrel model • Cells 660 ft x 660 ft (200 m x 200m) and ~3 ft (1 m) thick on average • 11 lithofacies • Six submodels (stratigraphically) Bohling, Dubois, Byrnes
Basic Workflow • Neural network(s) trained on log-lithofacies relationships in 27 cored wells (15 Chase, 16 Council Grove) • Lithofacies predicted in ~1600 logged wells • Sequential indicator simulation of lithofacies, sequential Gaussian simulation of porosity • Permeability, capillary pressure, water saturation from lithofacies-specific functions of porosity and height above free water level Bohling, Dubois, Byrnes
Neural Network Structure Bohling, Dubois, Byrnes
Neural Network Parameter Selection Looking for optimal values of network size and damping parameter Each cored well removed in turn from training set Neural net trained on remaining wells; predictions compared to core in withheld well Five trials per well and parameter combination Sundry measures of prediction accuracy computed Bohling, Dubois, Byrnes
Variation of Crossvalidation Results Different symbol style for each (withheld) well; 5 trials per well; 14 wells (Upper Chase) Line is median, shown on previous slide Variability among wells larger than variability among parameter sets On the other hand, accuracy of predictions not hugely sensitive to choice of parameters Bohling, Dubois, Byrnes
Variability of Neural Net Predictions Five realizations of neural net – different initial weights Predicting on a cored well withheld from training set Some variability, but big picture is the same This source of variation not pursued further; one network used Bohling, Dubois, Byrnes
Lithofacies Variograms Variogram fitting problematic due to volume of data, number of facies (11) and intervals (23), trends and/or zonal anisotropy Upscaled data at wells exported from Petrel to R for automated analysis Exponential variograms with zero nugget imposed by fiat; ranges estimated for each facies and stratigraphic submodel (six of them) Vertical fits mostly OK, horizontal fits . . . well, a little iffy Bohling, Dubois, Byrnes
Porosity Variograms Porosity variograms generally rattier than facies variograms Automatically estimated ranges for all variograms (facies and porosity) then generalized/adjusted to reduced set of range values (by facies, one set for Chase, another for Council Grove); ranges ~20-40 kft SIS for facies, SGS for porosity – only one realization for full model Bohling, Dubois, Byrnes
Submodel for Uncertainty Assessment Stratigraphically continuous model for 2200 mi2 (5700 km2) east-west “laydown” across middle of field; ~24 million cells Assembled by Manny Valle, Oxy 200 realizations of entire workflow – facies SIS, porosity SGS, property and OGIP computations – saving only OGIP 10 realizations saving all intermediate properties OGIP evaluated for whole model and low-, medium-, and high-data density regions Properties examined at a synthetic well in each of three regions Bohling, Dubois, Byrnes
Varying Well Density Regions Each region is one township in size (36 mi2, 93 km2) Low density: 2 wells, both Chase and Council Grove Medium density: 9-14 Chase, 7-8 Council Grove High density: 20-25 Chase, 20-22 Council Grove Evaluation of data density effects will be obscured somewhat by variations in geological setting Bohling, Dubois, Byrnes
Facies Variation at Synthetic Wells Bohling, Dubois, Byrnes
Porosity Variation at Synthetic Wells Bohling, Dubois, Byrnes
Perm, Sw, OGIP vfn Ss crs sltstn Permeability (k), Sw, and OGIP for each cell computed as functions of lithofacies and porosity (f) k – f(Lith, f) Sw = f(Lith, f, FWL) fn-med sltstn Grnst Pkst Wkst Mdst mxln moldic Dol. vfxln Dol k-f relationships Bohling, Dubois, Byrnes
Stabilization of OGIP Distribution Bohling, Dubois, Byrnes
Overall Pore Volume, OGIP Variation Bohling, Dubois, Byrnes
OGIP Variation by Data Density Area Bohling, Dubois, Byrnes
Conclusions • Study illustrates development of a lithofacies-based matrix properties model for a giant gas field • The 108-million cell, 169-layer geomodel was developed by: • Defining lithofacies in 1600 wells with neural network models trained on core lithofacies-to-log correlations • Modeling between wells using sequential indicator simulation (SIS) for lithofacies and sequential gaussian simulation (SGS) for porosity • Calculating permeability, capillary pressure, and relative permeability for each unique lithofacies-porosity combination using empirical transforms • Calculating water saturation using the lithofacies/porosity-specific capillary pressure and a location-specific height-above-free-water level • Because horizontal ranges for estimated variograms (20-40 kft) are > than node well spacing (~1-3 kft), expected multiple realizations from stochastic simulations to be nearly deterministic; perhaps approaching that where well density is high • Variations in OGIP estimates quite small, at least in areas of moderate to high data density • The Hugoton geomodel illustrates the continuum between stochastic and deterministic modeling and the dependence of the methodology used for each property on the available data, the scale of prediction, and the order (predictability) of the system relative to the property being modeled Bohling, Dubois, Byrnes
Acknowledgements We thank our industry partners for their support of the Hugoton Asset Management Project and their permission to share results of the study. Anadarko Petroleum Corporation BP America Production Company Cimarex Energy Co. ConocoPhillips Company E.O.G. Resources Inc. ExxonMobil Production Company El Paso Exploration & Production Osborn Heirs Company OXY USA, Inc. Pioneer Natural Resources USA, Inc. and Schlumberger for providing software Bohling, Dubois, Byrnes