Download
1 / 16
160 likes | 239 Views
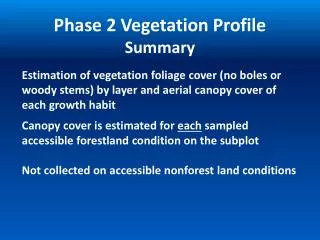
Phase 2 Vegetation Profile Summary. Estimation of vegetation foliage cover (no boles or woody stems) by layer and aerial canopy cover of each growth habit. Canopy cover is estimated for each sampled accessible forestland condition on the subplot

E N D
Phase 2 Vegetation ProfileSummary Estimation of vegetation foliage cover (no boles or woody stems) by layer and aerial canopy cover of each growth habit Canopy cover is estimated for each sampled accessible forestland condition on the subplot Not collected on accessible nonforest land conditions
Plot Level Variables - filled in for you • SAMPLING STATUS • 0 - Veg not sampled (no further veg data required) • 1 - Veg sampled on accessible forest land conditions • LEVEL OF DETAIL • - Collect data for Vegetation Structure only • Levels 2 & 3 deal with species specific cover estimates which SRS-FIA may or may not go to in the future.
Subplot Level Variables • SUBPLOT NUMBER • P2 VEG SUBPLOT SAMPLE STATUS • - Subplot sampled for P2 Vegetation • - Subplot not sampled for P2 Vegetation • VEGETATION NONSAMPLED REASON • - Other (for example, snow or water covering • vegetation that is supposed to be sampled)
Subplot Level Variables Cont. CONDITION CLASS NUMBER Record the number for the sampled accessible forested condition in which the vegetation is found. If multiple forested conditions occur on the same subplot, veg cover will be collected for each condition. VEGETATION SUBPLOT NOTES Use this field to record notes pertaining to the subplot, and any unusual conditions encountered.
Growth Habits Tree spp Growth Habits include seedlings, saplings and mature trees – NO MINIMUM HEIGHT REQUIREMENT
Questionable Growth Habits Bamboo and Cane = Grasses Cacti, Yucca and other Agave = Shrubs Spanish moss and other bromeliads = Forb/Herb Herbaceous vines like Philodendron = Forb/Herb Blackberries, Raspberries = Shrubs *Mistletoe = Shrub Clubmoss aka Groundpine = Shrub Indian Pipe and Squaw Root = Forb
Questionable Growth Habits continued For a woody species that is not on the SRS-FIA tally list and exhibits both tree and shrub growth forms: - Single dominant stem and will grow >13’ tall = non-tally tree (NT). - No single dominant stem = shrub growth habit (SH). Be consistent throughout the subplot-condition. The growth habit of these tree/shrub species could be different on separate subplot-conditions.
4 Layers and Aerial View Aerial View * Within each layer and aerial view - Examine each Growth Habit individually as if the other Growth Habits do not exist
The layers are parallel to the slope of the ground. To determine the layer of a plant, measure the height of the foliage from the ground directly underneath the foliage. For example: If the plant is rooted on top of a boulder – layers begin at the ground underneath the boulder.
Aerial View Coverage The total aerial canopy cover for a growth habit must be equal to or greater than the highest canopy cover recorded for an individual layer in that growth habit, but cannot be greater than the sum of all canopy covers recorded for all layers in that growth habit For example: Hypothetical 5% perfect column of tree foliage cover Hypothetical 5% shrub cover without any overlap In this example the aerial cover for TT or SH cannot be less than 5% or greater than 20%
Estimating Canopy Cover Canopy cover is estimated by drawing an outline around the outer edges of the foliage (include gaps) P2 Veg cover estimates end at 24 feet (like a cylinder). Plant foliage is included in the condition it is hanging over, even if the plant is rooted in a different condition.
If multiple sampled accessible conditions occur on a subplot, treat the condition boundary as a vertical wall on the plot.
Canopy Cover C2=30% For example: if Condition 2 is 30% then maximum cover is 30% (NOT 100%) The maximum possible canopy cover is the percentage of the subplot area within the accessible condition C1=70%
Canopy Cover • Foliage that is OR WAS alive during the current growing season is included in the cover estimates, unless stem is completely detached. • Include broken stems if still attached. • Record cover to the nearest percent (trace amounts are recorded as 1%)
Canopy cover by layer and growth habit *Do not include stems and boles into the cover estimate.