Download
1 / 16
170 likes | 359 Views
Extreme rainfall and flooding in South Africa during the 2010-2011 austral summer season Hannes Rautenbach 1 and Elsa de Jager 2 1 University of Pretoria, South Africa 2 South African Weather Service

E N D
Extreme rainfall and flooding in South Africa during the 2010-2011 austral summer season Hannes Rautenbach1 and Elsa de Jager2 1University of Pretoria, South Africa 2South African Weather Service SATREPS Symposium on Simulation and Prediction of Climate Modes Influencing the southern African Region 17-18 March 2011 University of Tokyo, Japan
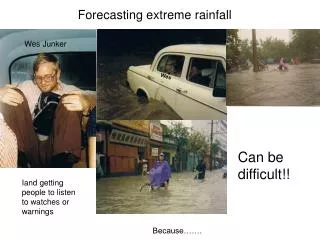
URBAN FLOODS Because of heavy rainfall during the 2010 / 2011 austral summer season floods occurred in many urban areas in the Gauteng, Northwest and Free State Provinces. Extreme rainfall events (short in time with a high fallout) often turned streets into rivers and caused structural damage.
AVERAGE RAINFALL AND 2010 ONSET Provincial rainfall: Comparison of provincial monthly rainfall for 2010 with a monthly average per province calculated over a 51-year period from 1960 to 2010. (Provincial monthly rainfall is computed using all the available rainfall figures for that province)
AVERAGE RAINFALL AND 2010 ONSET Provincial rainfall: Comparison of provincial monthly rainfall for 2010 with a monthly average per province calculated over a 51-year period from 1960 to 2010. (Provincial monthly rainfall is computed using all the available rainfall figures for that province)
AVERAGE RAINFALL AND 2010 ONSET Note: Only Province with rainfall peak in austral winter. Lets look closer at November, December, January and February (2010-2011) daily rainfall for eastern interior stations: Gauteng and Northwest Provinces
DAILY RAINFALL TOTALS: EASTER INTERIOR NOVEMBER 2010 DECEMBER 2010 JANUARY 2011 FEB 2011 GAUTENG PROVINCE (a) (b) NORTHWEST PROVINCE Two major rainfall episodes appeared between 8 and 17 December 2010 (a), and between 29 December 2011 and 6 January 2011 (b) Provincial rainfall Comparison of provincial monthly rainfall for 2010 with a monthly average per province calculated over a 51-year period from 1960 to 2010. (Provincial monthly rainfall is computed using all the available rainfall figures for that province)
SYNOPTIC CIRCULATION www.sat.dundee.ac.uk CYNOPTIC CIRCULATION DURING A HIGH RAINFALL EVENT:8 to 17 DECEMBER 2010 Sea level pressure (hPa) from NCEP-NCAR reanalyses data
SYNOPTIC CIRCULATION www.sat.dundee.ac.uk CYNOPTIC CIRCULATION DURING A HIGH RAINFALL EVENT:29 DECEMBER 2010 to 6 JANUARY 2011 Sea level pressure (hPa) from NCEP-NCAR reanalyses data
PERCENTAGE OF NORMAL RAINFALL (2010) Rainfall anomalies expressed as % of normal (top) and recorded rainfall totals in mm (bottom) for the months November and December 2010 – source: South African Weather Service (SAWS)
PERCENTAGE OF NORMAL RAINFALL (2011) Rainfall anomalies expressed as % of normal (top) and recorded rainfall totals in mm (bottom) for the months January and February 2011 – source: South African Weather Service (SAWS)
URBAN FLOODS Major river drainage regions in South Africa A: Limpopo river catchment B: Olifants river catchment C: Vaal river catchment D: Orange river catchment The two largest river drainage regions, Vaal and Orange river catchments, are characterised by water flowing from the eastern highlands across South Africa towards the west where water is drained into the Atlantic Ocean. High rainfall in the east may thus result in flooding over an extensive area as water flows over the long distance to the west.
FLOODS IN THE LOWER ORANGE RIVER Flood status in South Africa on 2011/01/22 from S.A. Weather and Disaster Information Service (SAWDIS). Water collected over a distance of more than 1000km, resulting in large volumes of water and flooding in the lower Orange River
FLOODS IN THE LOWER ORANGE RIVER Augrabies Waterfall High rainfall over the eastern austral summer rainfall region of South Africa led to large volumes of water flowing from river catchments to the ocean. The Orange River, for example, allowed for flood water to flow from the eastern highlands through the dry west towards the Atlantic Ocean Augrabies Waterfall The flooding of the Orange River could be seen in a spectacular display at the Augrabies Waterfall in the Northern Cape Province
SEASONAL FORECAST BY SOUTH AFRICAN WEATHER SERVICE (SAWS) Extremes (15th and 85th percentile thresholds) rainfall forecast for SON issued in August – suggesting a slow start to the rainfall season
SEASONAL FORECAST BY SOUTH AFRICAN WEATHER SERVICE (SAWS) The slow start was predicted in August to be followed by above-normal rainfall totals
SEASONAL FORECAST BY SOUTH AFRICAN WEATHER SERVICE (SAWS) Extremes rainfall forecast for DJF issued in November