Download
1 / 4
40 likes | 48 Views
ANALYSIS TOOLS ROAD MAP Measure Phase:. X – input(s). Process. Y - output(s). Qualitative Process Description Tools:. Process Flow Chart (VA Vs. NVA) / Process Map (As-Is) Variable Identification (inputs, outputs) Data Collection Plan VOC Analysis / Quality Function Deployment.

E N D
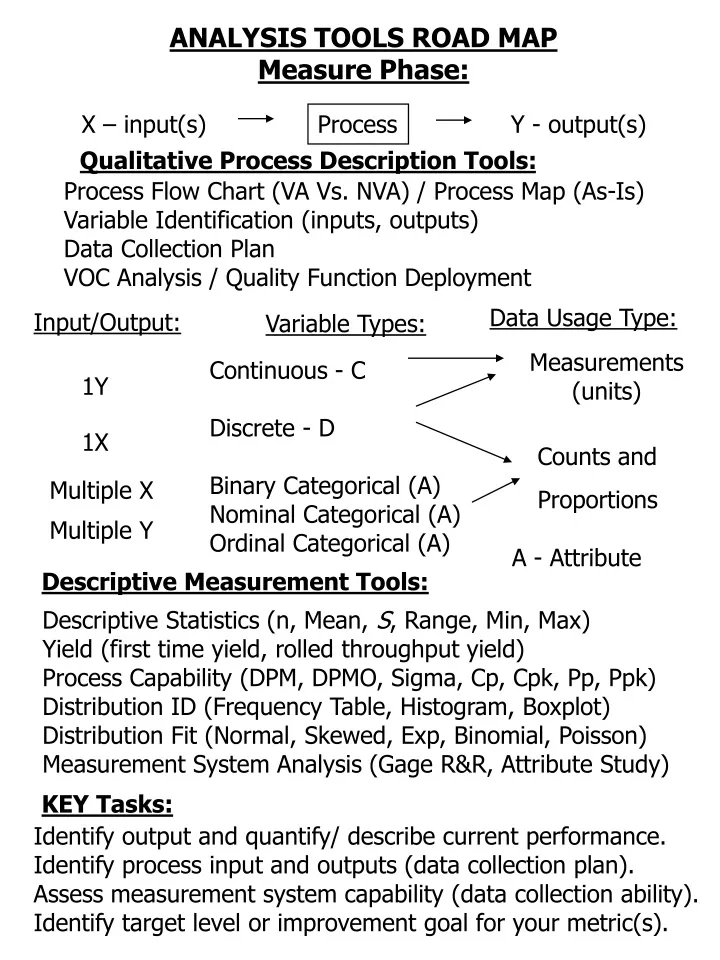
ANALYSIS TOOLS ROAD MAP Measure Phase: X – input(s) Process Y - output(s) Qualitative Process Description Tools: Process Flow Chart (VA Vs. NVA) / Process Map (As-Is) Variable Identification (inputs, outputs) Data Collection Plan VOC Analysis / Quality Function Deployment Data Usage Type: Input/Output: Variable Types: Measurements (units) Continuous - C Discrete - D Binary Categorical (A) Nominal Categorical (A) Ordinal Categorical (A) 1Y 1X Counts and Proportions Multiple X Multiple Y A - Attribute Descriptive Measurement Tools: Descriptive Statistics (n, Mean, S, Range, Min, Max) Yield (first time yield, rolled throughput yield) Process Capability (DPM, DPMO, Sigma, Cp, Cpk, Pp, Ppk) Distribution ID (Frequency Table, Histogram, Boxplot) Distribution Fit (Normal, Skewed, Exp, Binomial, Poisson) Measurement System Analysis (Gage R&R, Attribute Study) KEY Tasks: Identify output and quantify/ describe current performance. Identify process input and outputs (data collection plan). Assess measurement system capability (data collection ability). Identify target level or improvement goal for your metric(s).
ANALYSIS TOOLS ROADMAP Analyze Phase (1 Y, 1 X): X – input(s) Process Y - output(s) Qualitative Process Analysis Tools: Process Flow Chart (VA Vs. NVA) / Process Map (As-Is) Variable Identification (inputs, outputs) Cause-and-Effect (Fishbone) Diagram Affinity Diagram, Tree Diagram, SIPOC Diagram Failure Mode and Effects Analysis Qualitative Analysis Tools: 1Y or 1X only Descriptive Measurement Tools Correlation / Simple Regression Stratification Analysis Scatter Plot Multiple Box Plots Pareto Analysis 1Y (C,D, or A) and 1X (> 2 levels) 1Y (C,D, or A) and 1X (X- time, order) Process Stability/ Control Chart Analysis Run Chart (X-axis: time, order) Reliability Analysis (Y: Survive/ Fail) 1Y (C,D, or A) and 1X(A) (2 groups) Mean Comparison Test (t-test) Variance Comparison Test (F-test) Proportion Tests 1Y (C,D, or A) and 1X(A) (> 2 groups) One-Way ANOVA (Single Factor) 1Y (A only) and 1X (2 or more groups) Categorical Regression
ANALYSIS TOOLS ROADMAP Analyze Phase (1 Y, Multiple X’s): X – input(s) Process Y - output(s) Qualitative Process Analysis Tools: Process Flow Chart (VA Vs. NVA) / Process Map (As-Is) Variable Identification (inputs, outputs) Cause-and-Effect (Fishbone) Diagram Affinity Diagram, Tree Diagram Failure Mode and Effects Analysis Qualitative Analysis Tools: 1Y and Multiples X’s (X’s not correlated) Multiple Regression Tolerance Analysis Design of Experiments (DOE)/ ANOVA (General Linear Model) (note: continuous X variables may be treated as attributes (High, Med, Low) 1Y and Multiples X’s (X’s correlated) Stepwise Regression (Separate Analysis of X’s) Multiple Y’s – for this course, we will treat independently. Advanced Black Belts – may use multivariate analysis tools. Multiple Correlated X’s to Multiple Correlated Y’s outside scope of course
ANALYSIS TOOLS ROADMAP Improve and Control Phase: Improvement Tools: Alternative Solution Evaluation Techniques Poke-yoke Analysis (mistake proofing) Future State Process Map Brainstorming Failure Mode and Effects Analysis Quality Function Deployment Control Tools: Poke-yoke Analysis (mistake proofing) Verifying results (see measure and analysis tools) Process Control Plans Statistical Process Control (SPC) Check Systems Process Standards