Download
1 / 27
270 likes | 284 Views
Remote Sensing and Active Tectonics. Barry Parsons and Richard Walker. Michaelmas Term 2011. Lecture 4. Landsat Image of the Epicentral Area of the Grevena Earthquake. RGB 542. Normal Faults near Kozani, Northern Greece. Rimnio Fault. Paleochori Fault.

E N D
Remote Sensing and Active Tectonics Barry Parsons and Richard Walker Michaelmas Term 2011 Lecture 4
Landsat Image of the Epicentral Area of the Grevena Earthquake RGB 542
Normal Faults near Kozani, Northern Greece Rimnio Fault Paleochori Fault
Spot Stereo Images for the Area of the Grevena Earthquake Above are a stereo pair of images of part of the Rimnio fault block to the east of the Paleochori fault. These were acquired one day apart by Spot 1 and Spot 4. One of the images is viewed from the right (incidence angle of 23°), the other is viewed from the left (incidence angle 14°). Which image is viewed from the right and which one from the left?
Enlargement of Spot Stereo Images over the Paleochori Fault Note the similar contrast patterns in each image. The matching algorithm will attempt to register similar patches in order to determine the stereo offsets between the images, and hence topographic relief.
Shaded Colour Topographic Map of the Area around the Paleochori Fault
Separating Amplitude and Direction of Colour Vectors The colour type is defined by the direction of the colour vector, its brightness (intensity) by the magnitude of the vector. By allowing colour tone to be controlled by one data set and intensity by another, we can combine properties of two data sets and image them simultaneously.
Enlarged Shaded Relief and Landsat Images around the Paleochori Fault RGB 542 The lefthand panel is a shaded relief map based on a 20m resolution DEM (digital elevation model) obtained from the SPOT stereo pairs. The colour is controlled by the height, and the intensity by the intensity of illumination of the slopes due to a sun in the SE at 45° above the horizon.
Synthetic Aperture Radar (SAR) ERS A SAR makes use of measurements of the range and Doppler shift of the radar returns to locate ground points. The signals from many returns are analysed together to image ground elements ~5x20m in size, much smaller than would be possible with a stationary antenna of the same size - hence the Synthetic Aperture.
Path difference results in phase shift 780 km 5.6 cm Interferometric SAR (InSAR) • SAR measures the amplitude and phase of the radar return. • Phase is a function of distance from satellite to ground (range).
SAR on ESA’s ERS Satellites • The SAR on ERS-1 and ERS-2 were used for InSAR between 1992 and 2000. Successor spacecraft Envisat launched March 1 2002. • Active illumination. • Orbit at 780 km; 501 orbit cycle repeats every 35 days. • 10 by 1 m antenna. • C-band (5.6cm) wavelength. • Not designed for InSAR
SAR Phase Variations due to Geometry (1) (2) (3) If there is pre-existing digital topography, can use it to fully remove geometric effects from measured phase differences
Measuring Surface Displacement with InSAR (1) • Remove the interferometric phase due to geometry and topography. • If the ground does not move, then residual phase will be zero apart from effects of environmental and instrumental noise.
Measuring Surface Displacement with InSAR (2) • Remove the interferometric phase due to geometry and topography. • If the ground does not move, then residual phase will be zero apart from effects of environmental and instrumental noise. • If the ground moves between SAR observations, then the residual phase will not be zero.
Dr = - n.u n where n is a unit vector pointing from the ground to the satellite u Dr Interferometric Phase due to Suface Displacement InSAR only measures the component of surface displacement in the direction of the line-of-sight to the satellite. Dfdef = (4p / l ) Dr i.e. 1 fringe = 28 mm l.o.s. deformation for ERS
Image A - 12 August 1999 Interferogram = Phase A - Phase B Remove phase from topography satellite positions earth curvature Image B - 16 September 1999 Making an Interferogram
(-20) 567 mm range decrease (-10) 283 mm range decrease (-3) 85 mm range decrease (-2) 57 mm range decrease (-1) 28 mm range decrease (0) 0 mm range change Unwrapping Interferometric Phases
SAR Interferometry for the 17 August 1999 (Mw 7.4) Izmit Earthquake, Turkey • Elastic dislocation modelling of SAR interferograms provides constraints on earthquake mechanisms. • The length scale, over which the displacement decays with distance from the fault, gives the depth extent of faulting. • Detailed analysis of the pattern of surface displacements gives the distribution of slip on the fault
ha = 500 m B = 20 m ha = 100 m B = 100 m Calculating Topography from Interferometric Phase • If the topography is unknown, remove geometrical effects on the assumption that z=0. • There will then be a residual phase due to the uncorrected effect of the topography, with 1 fringe for each change in elevation of ha. • B is the component of the baseline between the satellite positions that is perpendicular to the line-of-sight to the ground. • In correcting phase for topography, a height error h produces a phase error 2p(h / ha)
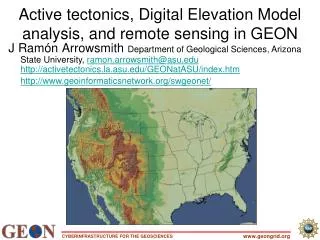
Location of the 13 May 1995 Ms 6.6 Grevena Earthquake, Northern Greece
20 km Slip Modelling for the Izmit Earthquake • Slip Model Seismic Hazard for neighbouring regions • Location of termination of slip in west is critical for calculation. • 30% chance of strong shaking in Istanbul in next 10 years, 60% chance in next 30 years [Parsons et al., Science, 2000]