Download

1 / 56
620 likes | 1.44k Views
Passive and Active Remote Sensing Systems

E N D
Passive and Active Remote Sensing Systems Passive remote sensing systems record electromagnetic energy that was reflected (e.g., blue, green, red, and near-infrared light) or emitted (e.g., thermal infrared energy) from the surface of the Earth. There are also active remote sensing systems that are not dependent on the Sun’s electromagnetic energy or the thermal properties of the Earth. Active remote sensors create their own electromagnetic energy that 1) is transmitted from the sensor toward the terrain (and is largely unaffected by the atmosphere), 2) interacts with the terrain producing a backscatter of energy, and 3) is recorded by the remote sensor’s receiver. Jensen, 2000
Active Remote Sensing Systems The most widely used active remote sensing systems include: • active microwave (RADAR), which is based on the transmission of long-wavelength microwaves (e.g., 3 – 25 cm) through the atmosphere and then recording the amount of energy back-scattered from the terrain; • LIDAR, which is based on the transmission of relatively short-wavelength laser light (e.g., 0.90 mm) and then recording the amount of light back-scattered from the terrain; and • SONAR, which is based on the transmission of sound waves through a water column and then recording the amount of energy back-scattered from the bottom or from objects within the water column. Jensen, 2000
Sending and Receiving a Pulse of Microwave EMR - System Components The discussion is based initially on the system components and functions of a real aperture side-looking airborne radar (SLAR). The discussion then expands to include synthetic aperture radars (SAR) that have improved capabilities. Jensen, 2000
Side-looking Airborne RADAR (SLAR) System Jensen, 2000
Sending and Receiving a Pulse of Microwave EMR - System Components The pulse of electromagnetic radiation sent out by the transmitter through the antenna is of a specific wavelength and duration (i.e., it has a pulse length measured in microseconds, msec). • The wavelengths are much longer than visible, near-infrared, mid-infrared, or thermal infrared energy used in other remote sensing systems. Therefore, microwaves are usually measured in centimeters rather than micrometers. • The unusual names associated with the radar wavelengths (e.g., K, Ka, Ku, X, C, S, L, and P) are an artifact of the original secret work on radar remote sensing when it was customary to use the alphabetic descriptor instead of the actual wavelength or frequency. Jensen, 2000
Active Microwave (RADAR) Commonly Use Frequencies Jensen, 2000
RADAR Wavelengths and Frequencies used in Active Microwave Remote Sensing Investigations Band Designations (common wavelengths Wavelength () Frequency () shown in parentheses)in cm in GHz _______________________________________________ K 1.18 - 1.67 26.5 to 18.0 Ka (0.86 cm) 0.75 - 1.18 40.0 to 26.5 Ku 1.67 - 2.4 18.0 to 12.5 X (3.0 and 3.2 cm) 2.4 - 3.8 12.5 - 8.0 C (7.5, 6.0 cm) 3.8 - 7.5 8.0 - 4.0 S (8.0, 9.6, 12.6 cm) 7.5 - 15.0 4.0 - 2.0 L (23.5, 24.0, 25.0 cm) 15.0 - 30.0 2.0 - 1.0 P (68.0 cm) 30.0 - 100 1.0 - 0.3 Jensen, 2000
Primary Advantages of RADAR Remote Sensing of the Environment • Active microwave energy penetrates clouds and can be an all-weather remote sensing system. •Synoptic views of large areas, for mapping at 1:25,000 to 1:400,000; cloud-shrouded countries may be imaged. • Coverage can be obtained at user-specified times, even at night. • Permits imaging at shallow look angles, resulting in different perspectives that cannot always be obtained using aerial photography. • Senses in wavelengths outside the visible and infrared regions of the electromagnetic spectrum, providing information on surface roughness, dielectric properties, and moisture content. Jensen, 2000
Secondary Advantages of RADAR Remote Sensing of the Environment • May penetrate vegetation, sand, and surface layers of snow. • Has its own illumination, and the angle of illumination can be controlled. • Enables resolution to be independent of distance to the object, with the size of a resolution cell being as small as 1 x 1 m. • Images can be produced from different types of polarized energy (HH, HV, VV, VH). • May operate simultaneously in several wavelengths (frequencies) and thus has multi-frequency potential. • Can measure ocean wave properties, even from orbital altitudes. • Can produce overlapping images suitable for stereoscopic viewing and radargrammetry. • Supports interferometric operation using two antennas for 3-D mapping, and analysis of incident-angle signatures of objects. Jensen, 2000
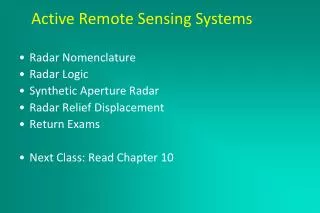
Radar Nomenclature • nadir • azimuth flight direction • look direction • range (near and far) • depression angle () • incidence angle () • altitude above-ground-level, H • polarization Jensen, 2000
Azimuth Direction • The aircraft travels in a straight line that is called the azimuth flight direction. • Pulses of active microwave electromagnetic energy illuminate strips of the terrain at right angles (orthogonal) to the aircraft’s direction of travel, which is called the rangeorlook direction. • The terrain illuminated nearest the aircraft in the line of sight is called the near-range. The farthest point of terrain illuminated by the pulse of energy is called the far-range. Jensen, 2000
Range Direction The range or look direction for any radar image is the direction of the radar illumination that is at right angles to the direction the aircraft or spacecraft is traveling. • Generally, objects that trend (or strike) in a direction that is orthogonal (perpendicular) to the range or look direction are enhanced much more than those objects in the terrain that lie parallel to the look direction. Consequently, linear features that appear dark or are imperceptible in a radar image using one look direction may appear bright in another radar image with a different look direction. Jensen, 2000
Look Direction Jensen, 2000
Depression Angle The depression angle (g) is the angle between a horizontal plane extending out from the aircraft fuselage and the electromagnetic pulse of energy from the antenna to a specific point on the ground. • The depression angle within a strip of illuminated terrain varies from the near-range depression angle to the far-range depression angle. The average depression angle of a radar image is computed by selecting a point midway between the near and far-range in the image strip. Summaries of radar systems often only report the average depression angle. Jensen, 2000
Incident Angle The incident angle (q) is the angle between the radar pulse of EMR and a line perpendicular to the Earth’s surface where it makes contact. When the terrain is flat, the incident angle (q) is the complement (q=90-g) of the depression angle (g). If the terrain is sloped, there is no relationship between depression angle and incident angle. The incident angle best describes the relationship between the radar beam and surface slope. • Many mathematical radar studies assume the terrain surface is flat (horizontal) therefore, the incident angle is assumed to be the complement of the depression angle. Jensen, 2000
Polarization Unpolarizedenergy vibrates in all possible directions perpendicular to the direction of travel. • Radar antennas send and receive polarized energy. This means that the pulse of energy is filtered so that its electrical wave vibrations are only in a single plane that is perpendicular to the direction of travel. The pulse of electromagnetic energy sent out by the antenna may be vertically or horizontallypolarized. Jensen, 2000
Polarization Jensen, 2000
Polarization Jensen, 2000
Polarization The transmitted pulse of electromagnetic energy interacts with the terrain and some of it is back-scattered at the speed of light toward the aircraft or spacecraft where it once again must pass through a filter. If the antenna accepts the back-scattered energy, it is recorded. Various types of back-scattered polarized energy may be recorded by the radar. Jensen, 2000
Polarization It is possible to: • send vertically polarized energy and receive only vertically polarized energy (designated VV), • send horizontal and receive horizontally polarized energy (HH), • send horizontal and receive vertically polarized energy (HV), or • send vertical and receive horizontally polarized energy (VH). Jensen, 2000
Polarization • HH and VV configurations produce like-polarized radar imagery. • HV and VH configurations produce cross-polarized imagery. Jensen, 2000
Slant-range versus Ground-Range Geometry Radar imagery has a different geometry than that produced by most conventional remote sensor systems, such as cameras, multispectral scanners or area-array detectors. Therefore, one must be very careful when attempting to make radargrammetric measurements. • Uncorrected radar imagery is displayed in what is called slant-range geometry, i.e., it is based on the actual distance from the radar to each of the respective features in the scene. • It is possible to convert the slant-range display into the true ground-range display on the x-axis so that features in the scene are in their proper planimetric (x,y) position relative to one another in the final radar image. Jensen, 2000
RADAR Resolution To determine the spatial resolution at any point in a radar image, it is necessary to compute the resolution in two dimensions: the range and azimuth resolutions. Radar is in effect a ranging device that measures the distance to objects in the terrain by means of sending out and receiving pulses of active microwave energy. The range resolution in the across-track direction is proportional to the length of the microwave pulse. The shorter the pulse length, the finer the range resolution. Pulse length is a function of the speed of light (c) multiplied by the duration of the transmission (t). Jensen, 2000
Range Resolution The range resolution (Rr) at any point between the near and far-range of the illuminated strip can be computed if the depression angle () of the sensor at that location and the pulse length () are known. It is possible to convert pulse length into distance by multiplying it times the speed of light (c = 3 x 10⁸ m sec-1). The resulting distance is measured in the slant-range previously discussed. Because we want to know the range resolution in the ground-range (not the slant-range) it is necessary to convert slant-range to ground-range by dividing the slant-range distance by the cosine of the depression angle (). Therefore, the equation for computing the range resolutionis: x c Rr = __________ 2 cos Jensen, 2000
Range Resolution Jensen, 2000
Azimuth Resolution Thus far we have only identified the length in meters of an active microwave resolution element at a specific depression angle and pulse length in the range (across-track) direction. To know both the length and width of the resolution element, we must also compute the width of the resolution element in the direction the aircraft or spacecraft is flying — the azimuth direction. Jensen, 2000
Azimuth Resolution Azimuth resolution (Ra) is determined by computing the width of the terrain strip that is illuminated by the radar beam. •Real aperture active microwave radars produce a lobe-shaped beam which is narrower in the near-range and spreads out in the far-range. Basically, the angular beam width is directly proportional to the wavelength of the transmitted pulse of energy, i.e., the longer the wavelength, the wider the beam width, and the shorter the wavelength, the narrower the beam width. Therefore, in real aperture (brute force) radars a shorter wavelength pulse will result in improved azimuth resolution. Unfortunately, the shorter the wavelength, the poorer the atmospheric and vegetation penetration capability. Jensen, 2000
Azimuth Resolution Fortunately, the beam width is also inversely proportional to antenna length (L). This means that the longer the radar antenna, the narrower the beam width and the higher the azimuth resolution. The relationship between wavelength (l) and antenna length (L) is summarized below, which can be used to compute the azimuth resolution: S x Ra = ___________ L where S is the slant-range distance to the point of interest. Jensen, 2000
Azimuth Resolution Jensen, 2000
RADAR Relief Displacement, Image Foreshortening, and Shadowing Geometric distortions exist in almost all radar imagery, including : • foreshortening, • layover, and • shadowing. Jensen, 2000
RADAR Relief Displacement: Foreshortening and Layover When the terrain is flat, it is a easy to use the appropriate equation to convert a slant-range radar image into a ground-range radar image that is planimetrically correct in x,y. However, when trees, tall buildings, or mountains are present in the scene, radar relief displacement occurs. • In radar relief displacement, the horizontal displacement of an object in the image caused by the object’s elevation is in a direction toward the radar antenna. Because the radar image is formed in the range (cross-track) direction, the higher the object, the closer it is to the radar antenna, and therefore the sooner (in time) it is detected on the radar image. This contrasts sharply with relief displacement in optical aerial photography where the relief displacement is radially outward from the principal point (center) of a photograph. The elevation-induced distortions in radar imagery are referred to as foreshortening and layover. Jensen, 2000
RADAR Foreshortening is Influenced by: • object height: The greater the height of the object above local datum, the greater the foreshortening. • depression angle (or incident angle): The greater the depression angle (g) or smaller the incident angle (q), the greater the foreshortening. • location of objects in the across-track range: Features in the near-range portion of the swath are generally foreshortened more than identical features in the far-range. Foreshortening causes features to appear to have steeper slopes than they actually have in the near-range of the radar image and to have shallower slopes than they actually have in the image far-range. Jensen, 2000
Forshortening, Layover, and Shadow Jensen, 2000
Foreshortening Jensen, 2000
RADAR Relief Displacement: Image Layover Image layover is an extreme case of image foreshortening. It occurs when the incident angle (q) is smaller than the foreslope (a+) i.e., q< a+. • This distortion cannot be corrected even when the surface topography is known. Great care must be exercised when interpreting radar images of mountainous areas where the thresholds for image layover exist. Jensen, 2000
Layover Jensen, 2000
RADAR Shadows Shadows in radar images can enhance the geomorphology and texture of the terrain. Shadows can also obscure the most important features in a radar image, such as the information behind tall buildings or land use in deep valleys. If certain conditions are met, any feature protruding above the local datum can cause the incident pulse of microwave energy to reflect all of its energy on the foreslope of the object and produce a black shadow for the backslope. Jensen, 2000
RADAR Shadows • A backslope is in radar shadow when its angle a- is steeper than the depression angle (g), i.e., a->g. • If the backslope equals the depression angle, a-=g, then the backslope is just barely illuminated by the incident energy. This is called grazing illumination because the radar pulse just grazes the backslope. • The backslope is fully illuminated when it is less than the depression angle (a-<g. ) Jensen, 2000
RADAR Shadow Characteristics • Unlike airphotos, where light may be scattered into the shadow area and then recorded on film, there is no information within the radar shadow area. It is black. • Two terrain features (e.g., mountains) with identical heights and fore- and backslopes may be recorded with entirely different shadows, depending upon where they are in the across-track. A feature that casts an extensive shadow in the far-range might have its backslope completely illuminated in the near-range. •Radar shadows occur only in the cross-track dimension. Therefore, the orientation of shadows in a radar image provides information about the look direction and the location of the near- and far-range. Jensen, 2000
RADAR Image Speckle Speckle is a grainy salt-and-pepper pattern in radar imagery present due to the coherent nature of the radar wave, which causes random constructive and destructive interference, and hence random bright and dark areas in a radar image. The speckle can be reduced by processing separate portions of an aperture and recombining these portions so that interference does not occur. This process, called multiple looks or non-coherent integration, produces a more pleasing appearance, and in some cases may aid in interpretation of the image but at a cost of degraded resolution. Jensen, 2000
Number of Looks Jensen, 2000
Synthetic Aperture Radar Systems A major advance in radar remote sensing has been the improvement in azimuth resolution through the development of synthetic aperture radar (SAR) systems. Remember, in a real aperture radar system that the size of the antenna (L) is inversely proportional to the size of the angular beam width. Great improvement in azimuth resolution could be realized if a longer antenna were used. Engineers have developed procedures to synthesize a very long antenna electronically. Like a brute force or real aperture radar, a synthetic aperture radar also uses a relatively small antenna (e.g., 1 m) that sends out a relatively broad beam perpendicular to the aircraft. The major difference is that a greater number of additional beams are sent toward the object. Doppler principles are then used to monitor the returns from all these additional microwave pulses to synthesize the azimuth resolution to become one very narrow beam. Jensen, 2000
Synthetic Aperture Radar Systems The Doppler principle states that the frequency (pitch) of a sound changes if the listener and/or source are in motion relative to one another. • An approaching train whistle will have an increasingly higher frequency pitch as it approaches. This pitch will be highest when it is directly perpendicular to the listener (receiver). This is called the point of zero Doppler. As the train passes by, its pitch will decrease in frequency in proportion to the distance it is from the listener (receiver). This principle is applicable to all harmonic wave motion, including the microwaves used in radar systems. Jensen, 2000
Synthetic Aperture Radar Jensen, 2000
Surface Roughness • Surface roughnessis the terrain property that most strongly influences the strength of the radar backscatter. When interpreting aerial photography we often use the terminology - rough (coarse), intermediate, or smooth (fine) - to describe the surface texture characteristics. It is possible to extend this analogy to the interpretation of radar imagery if we keep in mind that the surface roughness we are talking about is usually measured in centimeters (i.e. the height of stones, size of leaves, or length of branches in a tree) and not thousands of meters as with mountains. • In radar imagery we are actually talking about micro-relief surface roughnesscharacteristics rather than topographic relief. Jensen, 2000
Surface Roughness • There is a relationship between the wavelength of the radar (), the depression angle (), and the local height of objects (h in cm) found within the resolution cell being illuminated by microwave energy. It is called the modified Rayleigh criteriaand can be used to predict what the earth's surface will look like in a radar image if we know the surface roughness characteristics and the radar system parameters ( , ,h) mentioned. Jensen, 2000
Surface Roughness in RADAR Imagery Expected surface roughness back-scatter from terrain illuminated with 3 cm wavelength microwave energy with a depression angle of 45˚. Jensen, 2000
Smooth and Rough Rayleigh Criteria • The area with smooth surface roughness sends back very little backscatter toward the antenna, i.e. it acts like a specular reflecting surface where most of the energy bounces off the terrain away from the antenna. The small amount of back-scattered energy returned to the antenna is recorded and shows up as a dark area on the radar image. The quantitative expression of thesmooth criteriais: h < ____ 25 sin A bright return is expected if the modified Rayleighrough criteriaare used: h > ____ 4.4 sin Jensen, 2000
Nile River Sudan Space Shuttle Color-Infrared Photograph SIR-C Color Composite: • Red = C-band HV • Green = L-band HV • Blue = L-band HH Jensen, 2000