Download
1 / 17
210 likes | 673 Views
Module 2: Cartography and Geovisualization Map Design. By : Aizhan Assylbekova , PhD ayzhan.gis@gmail.com Cartography and Geoinformatics Department, KazNU Al- Farabi. 16 August 2012. Hungary, 13-18 August 2012. Description. Objectives The main components, or building blocks, of a map

E N D
Module 2: CartographyandGeovisualizationMap Design By: AizhanAssylbekova, PhD ayzhan.gis@gmail.com CartographyandGeoinformatics Department, KazNU Al-Farabi 16 August 2012 Hungary, 13-18 August 2012
Description • Objectives • The main components, or building blocks, of a map • The qualities of a map that are important in communicating information to map users • The types of maps that can be developed to visually and quickly communicate information to an audience 2 Hungary, 13-18 August 2012
Mapmakers need to understand… • The objective(s) of the map (the message) • The people who may use the map (the audience) • The data that will be displayed in the map (the info • rmation available) • The use of graphics software for displaying map information • The final format of the printed or digital version of the map (the product) 3 Hungary, 13-18 August 2012
Bibliography M.J. Kraak and F. Ormeling (2009): Cartography: Visualization of Spatial Data. Prentice Hall T. Slocum (2003): Thematic Cartography and Geographic Visualization. Prentice Hall. Teaching and learning methods Lectures, lab work, self-study on articles in magazines Required infrastructure Class room with computer projector, computer laboratory with GIS software and data Assessment To pass this module, the students are required to complete all exercises; successfully present the final project and pass the written exam 4 Hungary, 13-18 August 2012
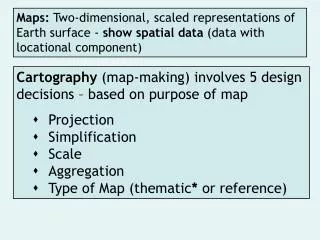
Map components • Symbology • Direction • Scale • Legend • Locational inset • Neatline • Typography • Color and contrast • Ancillary information (caveats and disclaimers) 5 Hungary, 13-18 August 2012
Symbology • The art of expression • Using graphics and text to convey meaning • Most GIS packages offer a robust suite of symbology choices 6 Hungary, 13-18 August 2012
Scale • The representation of map figures to their on the ground equivalents • A key part of most maps • Several different approaches • Graphical • Equivalent • Proportional http://www.proza.ru/pics/2011/08/10/103.jpg 7 Hungary, 13-18 August 2012
Color and contrast • People associate colors of mapped features with events, emotions, and socio-economic status • Although men and women react similarly to color, some reactions may vary depending on culture (Valdez & Mehrabin 1994) • How do you react to different colors? Hungary, 13-18 August 2012
The most popular colour schemes CMYK http://image-24.ru/wp-content/uploads/2010/06/rgb.gif Red, Green, Blue - Additive colors http://t1.ftcdn.net/jpg/00/12/11/50/400_F_12115010_WVSCD8xd8lsamF2GU7p6QXxvKrdpn11A.jpg Hungary, 13-18 August 2012 Cyan, Magenta, Yellow -Subtractive colors
Classification of map symbols http://docs.huihoo.com/mapserver/5.2.1/_images/carto-elements.png Hungary, 13-18 August 2012 Hungary, 13-18 August 2012
Text By adding text to map we improve its visualization of geographic information http://www.lib.utexas.edu/maps/americas/middleamerica.jpg Hungary, 13-18 August 2012
Annotation Annotation is a feature class Hungary, 13-18 August 2012
What should be on your map? Hungary, 13-18 August 2012 Audience- are they all familiar with your study area? Is an inset required? Will others need to track your sources ? Do you need to record where the map is stored? Are revisions expected or will the study area change (date)? Title, scale, author, and north arrow are safe bets Publication outlets may have their own guidelines
Common map problems Hungary, 13-18 August 2012 • Wrong audience • Omitting a necessary element • Too much clutter (symbology) • Too much detail (annotation) • Plotter or printer produces something different than what you see on the screen
Cartographer Responsibility Hungary, 13-18 August 2012 How to Lie with Maps (Monmonier 1996) Drawing the Line, Tales of Maps and Controversy (Monmonier 1995) Models of reality Many simply accept maps at face value Be discriminate in your appraisal and interpretation of maps Be clear and ethical in your creation of maps
Map composition PROBABILISTIC MAP OF SEISMIC RISK Map from Atlas of natural and technological hazards and risks of emergencies in the Republic of Kazakhstan (2010) Hungary, 13-18 August 2012
Thank you for your attention! Questions??? Hungary, 13-18 August 2012