Download
1 / 6
60 likes | 156 Views
Model experiments. CAM4.0 was run for 10 years without any forcing at 1deg resolution - the control run (data ocean ). Each of the forced experiments were run for 135 days.

E N D
Model experiments • CAM4.0 was run for 10 years without any forcing at 1deg resolution - the control run (data ocean). • Each of the forced experiments were run for 135 days. • 18 forced experiments with eastward moving heating and cooling signals were run - each for 10 different initial conditions : • the 31 May of each year from the control run - 10 JJAS I.C. • the 30 Nov of each year from the control run - 10 DJFM I.C. • 2 forced experiments with northward moving forcing were run - each for 10 different initial conditions, 1 for each season’s I.C. • 2 forced experiments with stationary forcing over the equatorial Indian Ocean were run - each for 10 different initial conditions, 1 for each season’s I.C. • 6 forced experiments each with varying latitudinal extent of observed Diabatic Heating were run - each for 10 different initial conditions, 3 for each season’s I.C.
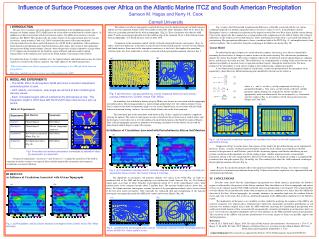
The forced experiments with idealized signals have heating and cooling cells based on idealized MJO-like oscillations: • ellipses with Gaussian distribution (cell size 60deg lon, 10deg lat) • with middle heavy and bottom heavy vertical profiles • alternate heating and cooling signals • maxima is 1.5K/day for both the profiles reducing to almost zero at the top and bottom of the atmosphere • They cover the equatorial Indo-Pacific region Vertical Profile: bottom heavy, middle heavy,
Forced Signals (Idealized) Multichannel singular spectrum (MSSA) has been used to identify the temporal variability and to determine the coherent intraseasonal space-time patterns for different variables. The 45 day period oscillation is studied, which also captures the MJO.
JJAS: Precipitation (mm/day) Observation Control_runf_rs3(45dp)
DJFM: Precipitation (mm/day) Observation Control_run f_rw3(45dp)
The JJAS season is better captured than the DJFM season by CAM4.0 as seen in the control run. • The best results are seen for the 45 day period (dp) oscillation with middle heavy vertical profile, for both the JJAS and DJFM seasons. • For JJAS, the 45dp forcing signal improves the anomaly band tilts. • For DJFM, the 45dp forcing signal improves the eastward propagation of the anomalies and reduces the northern hemispheric anomalies. • It is interesting to note that an eastward propagating forcing improves the latitudinal structure of the anomalies.