Download
1 / 13
130 likes | 270 Views
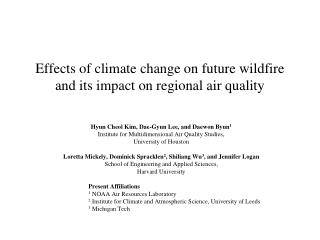
ozone episode. June 24, 2003. A statistical method for calculating the impact of climate change on future air quality over the Northeast United States. . Collaborators: Cynthia Lin, Katharine Hayhoe, Edwin Maurer, Christian Hogrefe, Pat Kinney, Daniel Jacob.

E N D
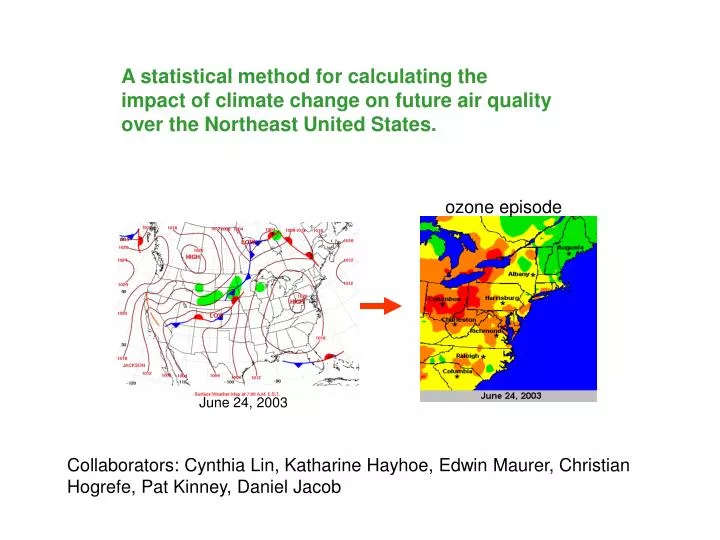
ozone episode June 24, 2003 A statistical method for calculating the impact of climate change on future air quality over the Northeast United States. Collaborators: Cynthia Lin, Katharine Hayhoe, Edwin Maurer, Christian Hogrefe, Pat Kinney, Daniel Jacob
Number of summer days with 8-hour average ozone > 84 ppbv over northeast U.S. sites Average num. of days Probability of ozone exceedance vs. daily max. temperature 1988, hottest on record Relationship of meteorology and ozone episodes Northeast Curves include effects of T-dependent biogenic emissions, stagnation, and chemistry. Lin et al., 2001 Curves represent the total derivative d[O3]/dT, the sum of partial derivatives (dO3/dxi)(dxi/dT), where x is the ensemble of ozone forcing variables that are temperature-related.
Observed probability of ozone exceedance vs. daily max. temperature Future temperature change over Northeast 1900-2100, calculated by many global climate models A statistical method to study effects of climate change on air quality. Idea: Use probabilities of ozone exceedance + daily GCM maximum temperatures to predict number of exceedance days for each summer in future. Step 1. Find exceedance probability for each model day’s maximum temperature Step 2. Sum up probabilities for ensemble of summer days to get total exceedances for that summer. 1. 2. + A1 Lin et al. 2001 = future smog episodes
Assumptions: • Emissions of ozone precursors remain constant over time. • For each region, the suite of conditions that lead to high ozone levels do not vary over time. • Models and scenarios: • Statistically downscaled temperatures from the GFDL, PCM, Hadley Centre models. • A1fi and B1 scenarios. A1fi Trends in CO2 emissions, 2000 to 2100 B1
Obs 1990s JJA daily max Temp Statistically downscaled GCM output Regional model, driven by GCM met at boundaries GCM 1990s • Statistically downscaled temperatures: use observations to train GCM. • Interpolate observed 1961-1990 temperatures onto 1/8o grid. Calculate monthly mean and variability at each gridpoint. • 2. Apply bias correction to GCM temperatures and apply observed probability density functions so that model matches observations. • T downscaled (x,t) = T GCM gridsquare (t) + a + b(x) + c(x,t) • 3. Apply these same fixes to future GCM data: possible problem? Hayhoe et al., 2006. Apologies for unclear temperature scales.
Frequency distributions of present-day daily maximum temperatures. Hadley Obs GCM, Northeast U.S. “Historical” means present-day. GCM data for 1961-1990: PCM, Hadley, and GFDL. Observations are for 1980-1998. GFDL PCM Obs Downscaling makes GCM output look nearly perfect. Mismatch at high end noted in Hayhoe et al., 2006, but may also be due to our spatial averaging. We are investigating. Downscaled, Northeast U.S. models
Summertime exceedances averaged over the Northeast, calculated using daily max temperatures statistically downscaled from three GCMs. Exceedance days averaged over the Northeast: • Increase by 10-30% by 2020s • Double by 2050 • Increase beyond 2050 depending on climate scenario and on model Caveats: • Assumption is that anthropogenic emissions remain constant. • Method does not capture high ozone episodes during recent past: we are investigating. • Use same technique for PM2.5? A1Fi CMAQ B1 observations Lin et al., 2007
Deterministic approach: Statistical approach: Advantages: day-by-day calculations, allows for changes in anthropogenic emissions of ozone precursors and for detailed diagnosis of causes of ozone change (transport, VOCs, boundary layer height, clouds. . .) Advantages: fast, takes into account many factors that affect ozone levels, based on observations, allows for easy model intercomparison across many years, good for near-term outlook. GCM met BC GCM Regional climate model Daily max Ts met fields statistical downscaling downscaled met Global chemistry model Regional chemistry model (i.e., CMAQ) Probabilities of ozone exceedances Exceedance = f (maxT) chem BC FUTURE AIR QUALITY
Frequency distributions for daily max temperatures: comparison between future model and observed present-day ~2100 GCM temperatures A1 scenario, Northeast U.S. present-day obs ~2100 downscaled temperatures present-day obs Frequency distributions are for 2070-2099 model results. Obs are from 1980-1999 Downscaled GCM output does not capture the change in temperature probability distributions. This could be a problem for calculating air quality.
Advantage of method: Quick gauge of ozone sensitivity to climate and of climate penalty. Limitations: Assumes constant emissions of ozone precursors, and unvarying temperature + met variable relationships Also may not capture variability of exceedances.
Emissions of carbon dioxide across the 21st century for a range of scenarios. Scenarios used by UCS: A1F1 B1
Hotter maximum temperatures Triangles indicate days of highest pollutant concentrations. 2050s 2000s Reduced cloud cover Unscaled GCM results are consistent with our previous research with GISS GCM: Our research shows that higher maximum temperatures are linked to longer stagnation periods in future climate. Reduced meridional temperature gradient + Increased eddy transport of latent heat fewer cold fronts + more persistent heat waves