Download
1 / 51
510 likes | 523 Views
Learn about different methods for image segmentation, such as region growing, split and merge, and clustering. Explore examples and understand the criteria for segmentation.

E N D
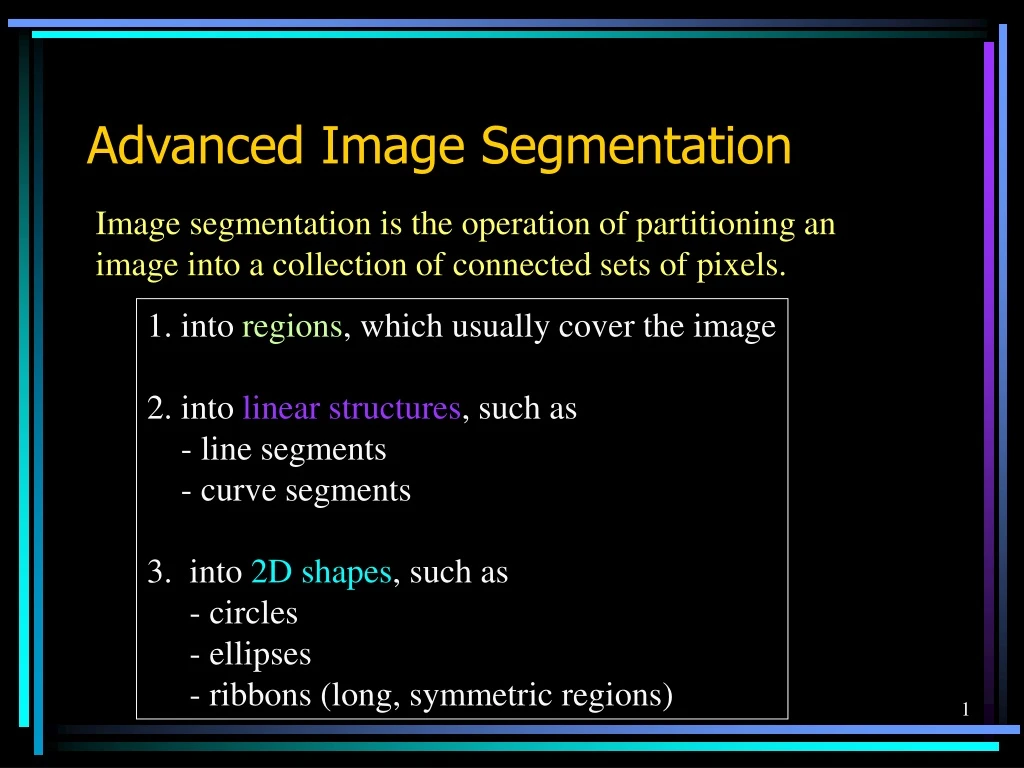
Advanced Image Segmentation Image segmentation is the operation of partitioning an image into a collection of connected sets of pixels. 1. into regions, which usually cover the image 2. into linear structures, such as - line segments - curve segments 3. into 2D shapes, such as - circles - ellipses - ribbons (long, symmetric regions)
Region Segmentation:Segmentation Criteria From Pavlidis A segmentation is a partition of an image I into a set of regions S satisfying: 1. Si = S Partition covers the whole image. 2. Si Sj = , i jNo regions intersect. 3. Si, P(Si) = true Homogeneity predicate is satisfied by each region. 4. P(Si Sj) = false,Union of adjacent regions i j, Si adjacent Sjdoes not satisfy it.
So So all we have to do is define and implement the similarity predicate. But, what do we want to be similar in each region? Is there any property that will cause the regions to be meaningful objects?
Main Methods of Region Segmentation • 1. Region Growing • 2. Split and Merge • 3. Clustering
Region Growing Region growing techniques start with one pixel of a potential region and try to growit by adding adjacent pixels till the pixels being compared are too disimilar. • The first pixel selected can be just the first unlabeled • pixel in the image or a set of seed pixels can be chosen • from the image. • Usually a statistical test is used to decide which pixels • can be added to a region.
The RGGROW Algorithm • Let Rbe the N pixel region so far and P be a neighboring • pixel with gray tone y. • Define the mean X and scatter S (sample variance) by • X = 1/N I(r,c) • S = 1/N (I(r,c) - X) 2 (r,c) R 2 2 (r,c) R
The RGGROW Statistical Test The T statistic is defined by (N-1) * N T = -------------- (y - X) / S (N+1) 1/2 2 2 It has a T distribution if all the pixels in R and the test pixel y are independent and identically distributed normals (IID assumption) . N-1
Decision and Update • For the T distribution, statistical tables give us the • probability Pr(T t) for a given degrees of freedom • and a confidence level. From this, pick suitable • threshold t. • If the computed T t for desired confidence level, • add y to region R and update X and S . • If T is too high, the value y is not likely to have arisen • from the population of pixels in R. Start a new region. 2
RGGROW Example image Not so great and it’s order dependent. segmentation
Split and Merge 1.Start with the whole image 2. If the variance is too high, break into quadrants • Merge any adjacent regions that are similar enough. • Repeat Steps 2 and 3, iteratively till no more splitting or merging occur Idea: Good Results: Blocky
Clustering • There are K clusters C1,…, CK with means m1,…, mK. • The least-squares error is defined as • Out of all possible partitions into K clusters, • choose the one that minimizes D. K 2 D = || xi - mk || . k=1 xi Ck Why don’t we just do this? If we could, would we get meaningful objects?
Some Clustering Methods • K-means Clustering and Variants • Histogram-Based Clustering and Recursive Variant • Graph-Theoretic Clustering • EM Clustering
K-means Variants • Different ways to initialize the means • Different stopping criteria • Dynamic methods for determining the right number of clusters (K) for a given image
Ohlander’s Recursive Histogram-Based Clustering • color images of real indoor and outdoor scenes • starts with the whole image • selects the R, G, or B histogram with largest peak • and finds clusters from that histogram • converts to regions on the image and creates masks for each • pushes each mask onto a stack for further clustering
Ohta suggested using (R+G+B)/3, (R-B)/2 and (2G-R-B)/4 instead of (R, G, B). Ohlander’s Method separate R, G, B tree2 tree1 sky
Jianbo Shi’s Graph-Partitioning • An image is represented by a graph whose nodes • are pixels or small groups of pixels. • The goal is to partition the vertices into disjoint sets so • that the similarity within each set is high and • across different sets is low.
Minimal Cuts • Let G = (V,E) be a graph. Each edge (u,v) has a weight w(u,v) • that represents the similarity between u and v. • Graph G can be broken into 2 disjoint graphs with node sets • A and B by removing edges that connect these sets. • Let cut(A,B) = w(u,v). • One way to segment G is to find the minimal cut. uA, vB
Cut(A,B) cut(A,B) = w(u,v). uA, vB B A w1 w2
Normalized Cut Minimal cut favors cutting off small node groups, so Shi proposed the normalized cut. cut(A, B) cut(A,B) Ncut(A,B) = ------------- + ------------- asso(A,V) asso(B,V) normalized cut asso(A,V) = w(u,t) uA, tV How much is A connected to the graph as a whole.
Example Normalized Cut B A 2 2 2 2 2 2 2 2 4 3 2 1 1 2 2 3 3 3 Ncut(A,B) = ------- + ------ 21 16
How Shi used the procedure Shi defined the edge weights w(i,j) by w(i,j) = e * ||X(i)-X(j)||2 / X e if ||X(i)-X(j)||2 < r 0 otherwise ||F(i)-F(j)||2 / I where X(i) is the spatial location of node i F(i) is the feature vector for node I which can be intensity, color, texture, motion… The formula is set up so that w(i,j) is 0 for nodes that are too far apart.
Examples of Shi Clustering See Shi’s Web Page http://www-2.cs.cmu.edu/~jshi
EM Algorithm and its Applications Prepared by Yi Li Department of Computer Science and Engineering University of Washington
From K-means to EM is from discrete to probabilistic K-means revisited Form K-means clusters from a set of n-dimensional vectors 1. Set ic (iteration count) to 1 2. Choose randomly a set of K means m1(1), …, mK(1). 3. For each vector xi, compute D(xi,mk(ic)), k=1,…K and assign xi to the cluster Cj with nearest mean. 4. Increment ic by 1, update the means to get m1(ic),…,mK(ic). 5. Repeat steps 3 and 4 until Ck(ic) = Ck(ic+1) for all k.
x1={r1, g1, b1} x2={r2, g2, b2} … xi={ri, gi, bi} … K-Means Classifier Classification Results x1C(x1) x2C(x2) … xiC(xi) … Classifier (K-Means) Cluster Parameters m1 for C1 m2 for C2 … mk for Ck
K-Means Classifier (Cont.) Input (Known) Output (Unknown) x1={r1, g1, b1} x2={r2, g2, b2} … xi={ri, gi, bi} … Classification Results x1C(x1) x2C(x2) … xiC(xi) … Cluster Parameters m1 for C1 m2 for C2 … mk for Ck
Output (Unknown) Input (Known) Initial Guess of Cluster Parameters m1 , m2 , …, mk x1={r1, g1, b1} x2={r2, g2, b2} … xi={ri, gi, bi} … Classification Results (1) C(x1), C(x2), …, C(xi) Cluster Parameters(1) m1 , m2 , …, mk Classification Results (2) C(x1), C(x2), …, C(xi) Cluster Parameters(2) m1 , m2 , …, mk Classification Results (ic) C(x1), C(x2), …, C(xi) Cluster Parameters(ic) m1 , m2 , …, mk
xi C(xi) K-Means (Cont.) • Boot Step: • Initialize K clusters: C1, …, CK Each cluster is represented by its mean mj • Iteration Step: • Estimate the cluster for each data point • Re-estimate the cluster parameters
For each cluster j K-Means EM • Boot Step: • Initialize K clusters: C1, …, CK • Iteration Step: • Estimate the cluster of each data point • Re-estimate the cluster parameters (j,j) and P(Cj)for each cluster j. Expectation Maximization
x1={r1, g1, b1} x2={r2, g2, b2} … xi={ri, gi, bi} … EM Classifier Classification Results p(C1|x1) p(Cj|x2) … p(Cj|xi) … Classifier (EM) Cluster Parameters (1,1),p(C1) for C1 (2,2),p(C2) for C2 … (k,k),p(Ck) for Ck
EM Classifier (Cont.) Input (Known) Output (Unknown) x1={r1, g1, b1} x2={r2, g2, b2} … xi={ri, gi, bi} … Cluster Parameters (1,1), p(C1) for C1 (2,2), p(C2) for C2 … (k,k), p(Ck) for Ck Classification Results p(C1|x1) p(Cj|x2) … p(Cj|xi) …
Expectation Step Input (Known) Input (Estimation) Output x1={r1, g1, b1} x2={r2, g2, b2} … xi={ri, gi, bi} … Cluster Parameters (1,1), p(C1) for C1 (2,2), p(C2) for C2 … (k,k), p(Ck) for Ck Classification Results p(C1|x1) p(Cj|x2) … p(Cj|xi) … +
Maximization Step Input (Known) Input (Estimation) Output x1={r1, g1, b1} x2={r2, g2, b2} … xi={ri, gi, bi} … Classification Results p(C1|x1) p(Cj|x2) … p(Cj|xi) … Cluster Parameters (1,1), p(C1) for C1 (2,2), p(C2) for C2 … (k,k), p(Ck) for Ck +
EM Algorithm • Boot Step: • Initialize K clusters: C1, …, CK • Iteration Step: • Expectation Step • Maximization Step (j,j) and P(Cj)for each cluster j.
EM Demo • Demo http://www.neurosci.aist.go.jp/~akaho/MixtureEM.html • Example http://www-2.cs.cmu.edu/~awm/tutorials/gmm13.pdf
EM Applications • Blobworld: Image segmentation using Expectation-Maximization and its application to image querying • Yi’s Generative/Discriminative Learning of object classes in color images
Image Segmentation using EM • Step 1: Feature Extraction • Step 2: Image Segmentation using EM
The feature vector for pixel i is called xi. There are going to be Ksegments; K is given. The j-th segment has a Gaussian distribution with parameters j=(j,j). j's are the weights (which sum to 1) of Gaussians. is the collection of parameters: =(1, …, k, 1, …, k) Symbols
Each of the K Gaussians will have parameters j=(j,j), where j is the mean of the j-th Gaussian. j is the covariance matrix of the j-th Gaussian. The covariance matrices are initialed to be the identity matrix. The means can be initialized by finding the average feature vectors in each of K windows in the image; this is data-driven initialization. Initialization