Download
1 / 27
270 likes | 439 Views
An Analysis of Survey of Financial Condition Data. September 19, 2013 Pennsylvania State Data Center, PSH Patricia A. Patrick, PhD, CPA, CFGM, CFE John M. Trussel , PhD, CPA. Survey of Financial Condition Data. Research Objective Dependent Variable Definition of Financial Distress

E N D
An Analysis of Survey of Financial Condition Data September 19, 2013 Pennsylvania State Data Center, PSH Patricia A. Patrick, PhD, CPA, CFGM, CFE John M. Trussel, PhD, CPA
Survey of Financial Condition Data Research Objective Dependent Variable Definition of Financial Distress Indicators of Financial Distress Population Data Method of Analysis Results Conclusions
Survey of Financial Condition Data Research Objective: To identify the indicators associated with financial distress in Pennsylvania municipalities
Survey of Financial Condition Data Dependent Variable: The municipality is experiencing symptoms of financial distress or not (binary –yes/no) Definition of Financial Distress: Any affirmative answer to the Survey of Financial Condition questions, if the question meets the criteria of Act 47
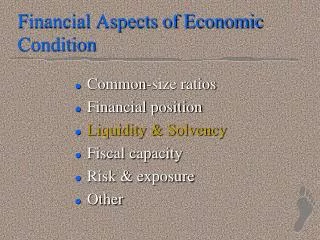
Survey of Financial Condition Data Indicators of Financial Distress: Socio-demographic data Economic data Financial data
Survey of Financial Condition Data Socio-demographic Indicators Population Pct. of Elderly Population Pct. of Poverty Pct. of Minorities Pct. with at least 4-yr Degree
Survey of Financial Condition Data Economic Indicators Median Household Incomes Market Values per Capita Pct. of Unemployed Population Growth Rates
Survey of Financial Condition Data Financial Indicators Fiscal Capacity (assessed value/population) Revenue per Capita Debt per Capita Taxes per Capita Tax Effort (1-(IGR/Total Revenue))
Survey of Financial Condition Data Population: All PA Municipalities Excludes counties Controlling variables: Type municipality (city, boro, twp) Rural/urban status (284 pp/mile)
Survey of Financial Condition Data Source of the data for the dependent variable: Survey of Financial Condition data from 2007 through 2010 Survey of Financial Condition data is collected annually by the Pennsylvania Department of Community & Economic Development (Form DCED-CLGS-69)
Survey of Financial Condition Data Source of socio-demographic indicators from 2005-09 ACS estimates: Population (2000 & 2010 census) Pct. of Elderly (ACS 2009) Pct. of Poverty (ACS 2009) Pct. of Minorities (ACS 2009) Pct. with 4-yr Degrees (ACS 2009)
Survey of Financial Condition Data Source of economic indicators from 2005-09 ACS estimates and U.S. Dept. Labor: Median HH Income (2009 ACS) Market Value per Capita (2009 ACS) Pct. of Unemployed (2009 Labor) PopulGrowth (2000 & 2010 census)
Survey of Financial Condition Data Data for Financial Indicators from DCED 2009 Annual Audit and Financial Report (DCED-CLGS 30): Fiscal Capacity (2009 AFR) Revenue per Capita (2009 AFR) Debt per Capita (2009 AFR) Taxes per Capita (2209 AFR) Tax Effort (2009 AFR)
Survey of Financial Condition Data Method of Analysis Descriptive Statistics to establish benchmarks Mean Median Standard Deviation Univariate tests to identify differences between two groups (distressed or not) T-tests
Survey of Financial Condition Data Results: 13% municipalities distressed 48% cities are distressed 13% boroughs are distressed 11% 1st class twps are distressed 11% 2nd class twps are distressed
Survey of Financial Condition Data Urban municipalities are more distressed than rural municipalities 50% urban cities are distressed 16% urban boroughs distressed 11% urban 1st class twps distressed 18% urban 2nd class twps distressed
Survey of Financial Condition Data Distress is highest in NE and SW regions NE & SW distressed since 1980s Steel mills and coal mines stopped Distress is reported most by: 41% of munis in Luzerne County (NE) 39% of munis in Pike County (NE)
Survey of Financial Condition Data Municipalities in the most rural counties did not report any distress:
Survey of Financial Condition Data Rural municipalities were responsible for most, if not all: Missed payrolls Failure to negotiate claims Bankruptcy filings
Survey of Financial Condition Data Urban municipalities were responsible for most, if not all: Unfunded pension liabilities Bond defaults
Survey of Financial Condition Data Symptoms of distress are increasing: In 2007 155 symptoms In 2008 205 symptoms In 2009 211 symptoms In 2010 286 symptoms 321 munis report 857 symptoms The average municipality experiences more than one symptom of distress
Survey of Financial Condition Data Rural municipalities with distress: Lower poverty rates Higher pct. with college degrees Higher HH incomes Higher property values Higher unemployment rates
Survey of Financial Condition Data Urban municipalities with distress: Higher poverty rates Higher pct. minorities Lower pct. with college degrees Lower HH incomes Lower property values Lower market values
Survey of Financial Condition Data Urban municipalities with distress: Higher unemployment rates Lower assessed valuations Lower revenue per capita Lower taxes per capita Lower tax effort
Survey of Financial Condition Data About 6% of the municipalities may be under-reporting distress: 6% urban munis may under-report 4% rural munis may under-report 2% urban muni may over-report 1% rural munis may over-report
Survey of Financial Condition DataConclusions Identifying distress is complex matter Yes answers to SOFC questions are not equal and may not indicate true distress Identification of indicators is somewhat arbitrary Chronic distress is structural and mitigation of distress in NE and SW regions will require new economic and development
Survey of Financial Condition Data Questions or Comments? Patricia A. Patrick papatrick@ship.edu 717-300-3767 John M. Trussel johntrussel@yahoo.com 423-602-7248