Download
1 / 31
310 likes | 451 Views
Financial Aspects of Economic Condition. Common-size ratios Financial position Liquidity & Solvency Fiscal capacity Risk & exposure Other. Liquidity. Does the government have the means available to cover its existing obligations in the short run?. Liquidity. Current ratio

E N D
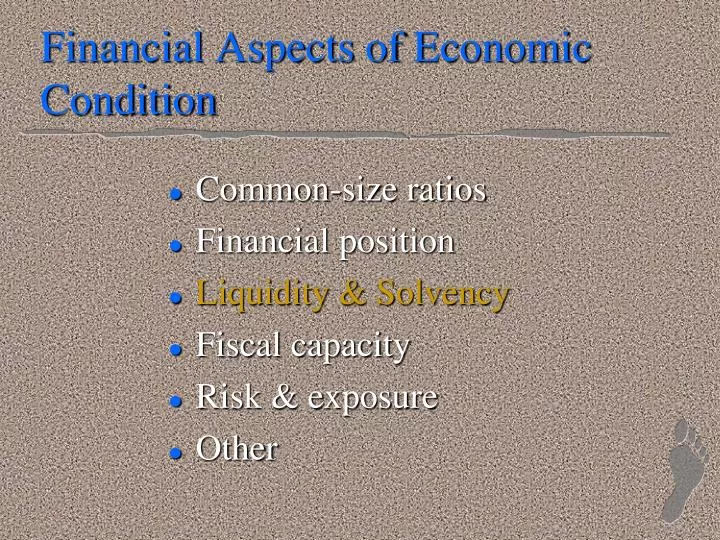
Financial Aspects of Economic Condition • Common-size ratios • Financial position • Liquidity & Solvency • Fiscal capacity • Risk & exposure • Other
Liquidity Does the government have the means available to cover its existing obligations in the short run?
Liquidity • Current ratio • Current assets ÷ current liabilities • Quick ratio • (cash + current investments) ÷ current liabilities
Liquidity: Current ratio Current assets ÷ current liabilities ÷ = 3.01
Remember not only to remove deferred revenues from the denominator, but also the corresponding assets in the numerator. = 3.15
In other words… The government’s current resources were equal to more than three times the debts that would come due during the next year.
Words of wisdom regarding financial position & liquidity ratios Making comparisons depends a lot on the timing of cash flows. For instance: • Government A receives its major state grant payments in the last month of the fiscal year. Its financial position and liquidity ratios may look much better than those of… • Government B, which collects most of its property taxes in the first month of the year.
Solvency Does the government have the means available to cover its existing obligations in the long run?
Solvency: Leverage • Debt-to-assets ratio • Total liabilities÷ total assets • Debt-to-net-assets ratio • Total liabilities ÷ net assets
Leverage: Debt-to-net-assets Total liabilities ÷ net assets ÷ = 0.863
In other words… More than 86 percent of the government’s net assets would have to be liquidated to satisfy its liabilities immediately.
Is that realistic? Almost 85 percent of its net assets are invested in capital assets. However, 95 percent of its liabilities are long-term debts.
Solvency: Coverage • Times-interest-earned • (cash flow from operations + interest expense) ÷ interest expense • Debt service coverage • (cash flow from operations + debt service) ÷ debt service
Problem with Coverage Ratios There is still no cash flow statement for the government as a whole; only for the proprietary funds. Consequently, an elegantly simple ratio like this: (cash flow from operations + interest expense) ÷ interest expense …becomes this…
(general fund revenues + special revenue fund revenues – general fund current expenditures – special revenue fund current expenditures + enterprise funds cash flows from operations + total interest on long-term debt for governmental and business-type activities) ÷ (total interest on long-term debt for governmental and business-type activities)
Solvency: Alternative Ratios • Liabilities ÷ total revenues • Liabilities ÷ personal income • Liabilities ÷ property value • Liabilities ÷ population • Debt service ÷ total expenditures • Debt service ÷ own-source revenues
Financial Aspects of Economic Condition • Common-size ratios • Financial position • Liquidity & Solvency • Fiscal capacity • Risk & exposure • Other
Fiscal Capacity Does the government have the financial ability to finance needed services going forward?
Fiscal Capacity • Debt per $100 of assessed property value • (total liabilities x 100) ÷ total assessed property value • Debt per capita • Total liabilities ÷ population • Property tax revenues per $100 of assessed value • (property tax revenues x 100) ÷ total assessed property value
Fiscal capacity: property tax revenues per $100 of assessed value (property tax revenues x 100) ÷ total assessed property value [(51,693,573 + 4,726,244) x 100) ÷ 3,923,863,884 = 1.44
Fiscal Capacity: Caution! • Be clear about definition of denominator, especially when it comes to property values!! • Valuation systems differ from government to government, as does the assessment ratio—the percentage of assessed value to market value • Makes comparisons difficult
Fiscal Capacity:Additional Ratios • Debt per $1,000 of personal income • Sales tax revenues ÷ total retail sales • Income tax revenues ÷ total personal income • Expenses & revenues per capita—both total and for specific client bases: • spending per pupil • state education aid per pupil • taxes per capita
Financial Aspects of Economic Condition • Common-size ratios • Financial position • Liquidity & Solvency • Fiscal capacity • Risk & exposure • Other
Risk and Exposure Can the government withstand unforeseen financial difficulties?
Risk and Exposure • Revenue dispersion (percentage distribution) • Risk exposure ratio • (investment revenue + intergovernmental aid) ÷ property tax revenues • Tax leverage ratio • operating expenses ÷ property tax revenues
Risk exposure ratio (investment revenue + intergovernmental aid) ÷ property tax revenue
Risk exposure ratio (2,559,493 + 5,176,310 + 4,894,915 + 1,475,820) ÷ 56,419,817 = 0.25
In other words… For every one percent decline in revenues beyond the government’s control, property taxes would have to be raised one-quarter of one percent.
Tax leverage ratio Operating expenses ÷ property tax revenue 117,111,882 ÷ 56,419,817 = 2.075
In other words… For every one percent increase in operating spending, the government would have to increase property taxes almost 2.1 percent.
Risk and Exposure:Additional Ratios • Property tax receivables ÷ current assets • Property tax receivables ÷ property tax levy • Uncollectable property taxes ÷ property tax levy