Download
1 / 25
250 likes | 388 Views
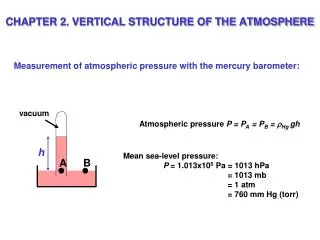
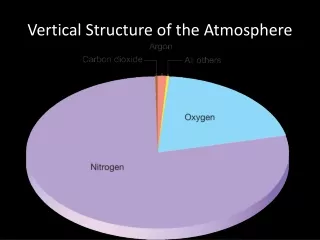
Ozone vertical structure. Joanna Struzewska Institute of Environmental Engineering Systems Warsaw University of Technology. Questions to refer. How good is the representation of ozone distribution in altitude? Of the ozone plume vertical structure?

E N D
Ozone vertical structure Joanna Struzewska Institute of Environmental Engineering SystemsWarsaw University of Technology
Questions to refer • How good is the representation of ozone distribution in altitude? Of the ozone plume vertical structure? • How well do modelled vertical structures in BL and in the above free troposphere compare with observations? • By how much does the vertical extend of ozone plumes differ between models?
Comment on “plume” • During IOP2a - due to the strong NW wind the “plume” over the sea and along the coast has been observed .... BUT .... • During windless day - typical for photochemical episodes - high ozone concentrations are observed over large area - the term “plume” is not applicable(can we find more adequate word ???)
Ozone vertical structure - mode accuracy • First two questions consider the same problem: How well models reproduced the vertical structure of PBL and the free troposphere comparing to available measurements • The answer requires analysis of: • character of available measurements • ability of the model
How good is the representation of ozone distribution in altitude? Of the ozone plume vertical structure? • Information on the ‘real’ vertical structure from: • ozone lidars(evolution of the ozone profile over selected points) • aircraft measurements(distribution of the ozone concentrations at the selected height in the short time span) ... Doesn’t really give the information on development of vertical structure... e.g. ozone reach layer may be placed on different altitude (due to model vertical resolution) or be transported / develop later
How good is the representation of ozone distribution in altitude? Of the ozone plume vertical structure? • Our expectations should correspond to the ability of the models: • for what purpose the model has been designede.g. episodic studies • hence: what are the model limitations? e.g.low model top (3km) • each model has a different level of ‘satisfactory agreement’ with measurements
How well do modelled vertical structures in PBL compare with observations? • Tendency to underestimation of the ozone budget within PBL: • IOP2a: most of the models underestimate ozone concentration within PBL (except of MOCAGE) • IOP2b: ozone concentration within PBL closer to observations, but the models tend to underestimate (except of MOCAGE, AZUR and CHIMERE)
How well do modelled vertical structures in PBL compare with observations? • In most of the models mixing layer height is similar • In most of the models ozone vertical profile is oversimplified - concentration almost equal with height (“too well” mixed layer?) • Underestimated losses within nocturnal layer
How well do modelled vertical structures in the free troposphere compare with observations? • Models designed for PBL episodic studies should be excluded from this comparison:AZUR, CHIMERE-1, POLAIR, UAM-TOTAL • During IOP2a free troposphere composition has been influenced by the stratospheric intrusion over North Atlantic on 18th of June - do we have it in our boundary conditions ?
How well do modelled vertical structures in the free troposphere compare with observations? • Vertical structure of free troposphere in general poorly reproduced (except of MOCAGE) • IOP2a: clean air mass (of Atlantic origin) above PBL not reproduced • IOP2a: descending ozone tongue of stratospheric origin difficult to reproduce • IOP2b: ozone rich air mass above PBL not reproduced
Answers to the questions 1 & 2 • How well do modelled vertical structures in BL and in the above free troposphere compare with observations? • The models tend to underestimate of the ozone budget within PBL (especially for IOP2a) • In most of the modelsozone vertical profile in PBL is oversimplified • Ozone loss within nocturnal layer is underestimated • Vertical structure of free troposphere in general poorly reproduced (insufficient BC connected with stratospheric intrusion and the transport from over the North Atlantic)
By how much does the vertical extend of ozone plumes differ between models? • Possible reasons of the differences: • Meteorological driver • Chemical module • “Boundary conditions”: • Vertical extend - model lid, sponge • Extend of the domain for the base run and time span for the simulation (Is the origin of air masses captured?)
Meteorological drivers and models’ configuration • ALADIN • MOCAGE-1, MOCAGE-2, CAMX-2 (forced) • MM5 • CHIMERE-1, AZUR, CHIMERE-ACRI • RAMS • MOCA-1. MOCA-2, RACM (on-line) • UAM-T-1, POLAIR,CAMX-1 • MC2 • MC2-AQ (on-line) Different model setup The same chemical solver Different version of the solver
Answers to the question 3 • By how much does the vertical extend of ozone plumes differ between models • models run with the same driver show similarities in the the ozone vertical structure • no significant differences for the same chemical solver (CAMX) used with different meteorological drivers (ALADIN vs. RAMS) • differences for two versions of chemical solver (MOCA-1, MOCA-2) run with the same meteorology (RAMS) • differences in final results for different model setup (domain extend, resolution, emission set for the base run) (MOCAGE-1 vs. MOCAGE-2) • no evidence for advantages of the use on-line vs. off-line models
Final comment • The models performance for IOP2b is better than for IOP2a. This is probably connected with the fact that some of the models are designed for episodic studies - with predominant photochemical production (like IOP2b). • During IOP2a the transport processes played very important role in the ozone distribution - hence the model were much more sensitive to the initial and boundary conditions (transport of clean air and the air of stratospheric origin from over the North Atlantic). • The intercomparison indicates that differences between chemical mechanisms and the model configuration have stronger impact on the results than use of different meteorological drivers
Lidar ALTO IOP2a & IOP2b classified by meteorological driver