Download
1 / 16
160 likes | 219 Views
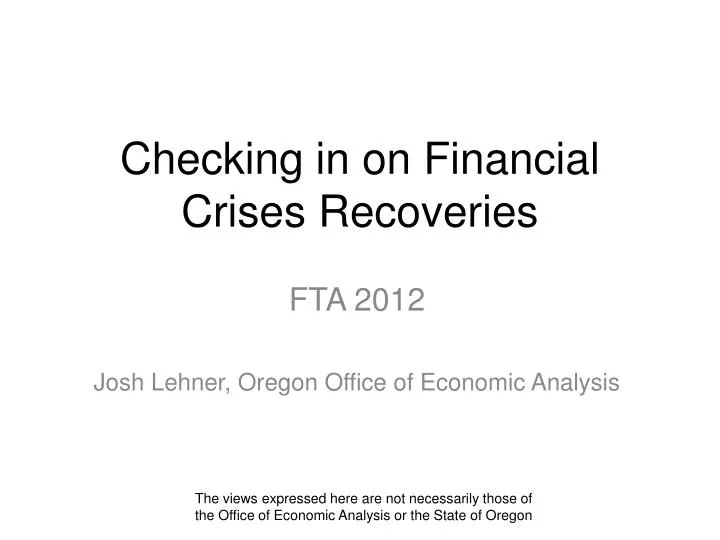
Checking in on Financial Crises Recoveries. FTA 2012 Josh Lehner , Oregon Office of Economic Analysis. The views expressed here are not necessarily those of the Office of Economic Analysis or the State of Oregon. Great Recession / Little Depression. Data through August, 2012.

E N D
Checking in on Financial Crises Recoveries FTA 2012 Josh Lehner, Oregon Office of Economic Analysis The views expressed here are not necessarily those of the Office of Economic Analysis or the State of Oregon
Great Recession / Little Depression Data through August, 2012
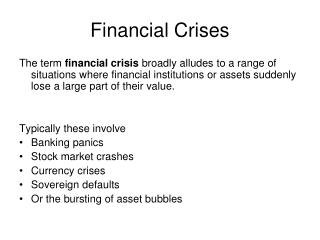
Financial Crises Precursors: • Markedly rising asset prices • Slowing real economic activity • Large current account deficits • Sustained debt buildup • Public or private
42.4% 6.0 Note: While the financial crisis began in 2007, the S&P Case-Shiller peaked in mid-2006 and the calculation used here is based on this peak. The real home price trough was reached in February 2012. Sources: S&P/Case-Shiller Home Price Indices, BLS
78.0% US, 2007 Note: To obtain inflation adjusted debt for a full three years the calculation dates chosen here are July 2008 – July 2011. Depending upon which dates one prefers, the percentage increase varies, e.g. Dec 2007 – Dec 2010 the increase is 73 percent. Source: BLS, U.S. Treasury – Debt Held by the Public
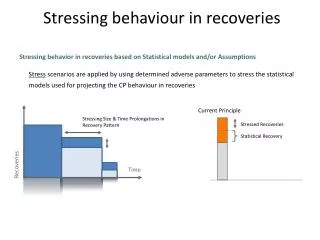
Employment Losses • Given the history of post WWII recessions in the US, the current level of job loss and slow recovery to date make the current cycle the clear outlier • Juxtapose the current US cycle against the Big 5 financial crisis in the developed world plus the Great Depression and the picture looks a bit different • That doesn’t necessarily mean the current outcome is acceptable
But We’ve Done Something Right Note: Return to peak duration given in parenthesis. Japan’s employment essentially reached a plateau in 1992, the start date used here is 1992 Q1. Sources: OECD, BLS
What Exactly is Different This Time? • “We have put a much higher floor on the initial contraction.” - Carmen Reinhart via Ezra Klein, Oct 15th 2012 • Monetary and Fiscal Policy • Coordinated, global response
Monetary Policy (Cont) Source: Federal Reserve Bank of Atlanta
Monetary Policy (Cont) Source: Federal Reserve Bank of Atlanta
Fiscal Policy Source: Brookings, March 2009 based on IMF and Brookings’ author’s calculations
Conclusion • The U.S. is experiencing your “garden-variety severe financial crisis.” • However labor markets are performing better than previous episodes. • Recovery path has been slow and steady.
Contact Information Standard Contact: (503) 378-4052 joshua.lehner@state.or.us www.oregon.gov/das/oea Social Media: oregoneconomicanalysis.wordpress.com @OR_EconAnalysis