Download
1 / 5
50 likes | 53 Views
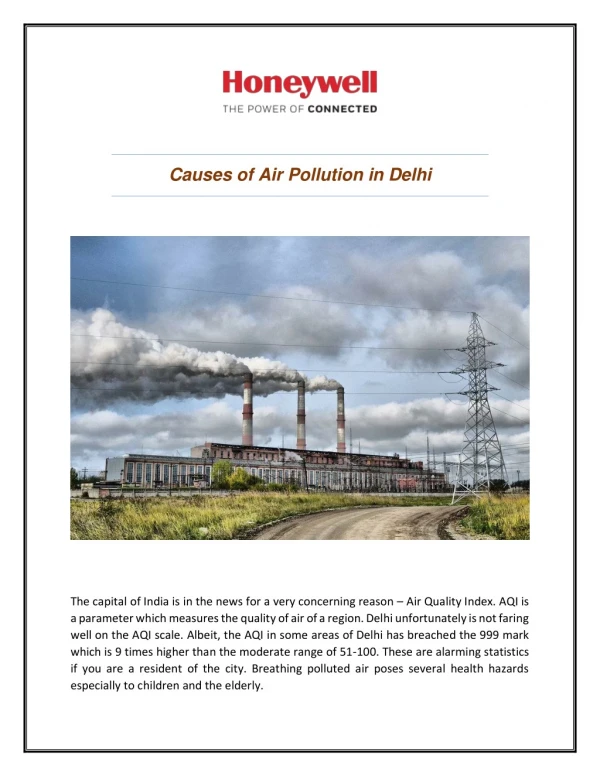
The human behaviour over the last few decades has changed the global atmospheric condition. The emission from automobiles, industrial emission, urban development, intensification of agricultural practices has escalate the levels of the harmful gases like CO2, CO, SO2, NO and Particulate Matter(PM) which probably changing the condition of the atmosphere and in turn harming us.

E N D
e-ISSN:2347-7830 p-ISSN:2347-7822 Research & Reviews: Journal of Ecology and Environmental Sciences Assessment of Air Pollution in Lucknow Geetika Saluja* Centre For Excellence at Varmora Granito Pvt Ltd, Ahmedabad, Gujarat, India Review Article Received: 07/02/2017 Accepted: 11/07/2017 Published: 18/07/2017 ABSTRACT The human behaviour over the last few decades has changed the global atmospheric condition. The emission from automobiles, industrial emission, urban development, intensification of agricultural practices has escalate the levels of the harmful gases like CO2, CO, SO2, NO and Particulate Matter(PM) which probably changing the condition of the atmosphere and in turn harming us. *For Correspondence Geetika Saluja, Head, Centre For Excellence at Varmora Granito Pvt Ltd, Ahmedabad, Gujarat, India, Tel: 090992 02222. The study aims at assessing the rate of air pollution in Lucknow with the focus on the Particulate Matter 10, Particulate Matter 2.5, Sulphur Dioxide and Nitrogen Dioxide. The study also reveals the major cause of the air pollution in Lucknow; the areas of Lucknow which are severely under pollution threats and monitoring the tracking mechanisms which has been set up; lacking equipments and the reason behind the same and little focus on the implemented awareness method among Lucknow is on air pollution. The study accounts the data of the recent months and the comparison to evaluate the increasing amount of level of pollution from last years. E-mail:geetikasaluja20@gmail.com Keywords: Particulate matter, Pollution, Deforestation rate, Industries, Equipments INTRODUCTION Lucknow city is the capital of Uttar Pradesh which has a population of 2.82 millions (Municipal Corporation and Cantonment) as per 2011 census. The Pollution means the contamination of the air. As per section 2(a) of Air(Prevention and Control of Pollution) Act,1981 air pollution has been defined as, “ any solid, liquid or gaseous substance (including noise) present in atmosphere in such concentration as may be or tend to be injurious to human being or other living creatures or plants or property of environment”. The clean air is the prior requirement for the healthy survival of the humans. As a consequence of urban development along with energy sector; vehicular emission too aiding in the rise of particulate matters. Besides these the other most thing found is the increase of the deforestation rate ion Lucknow to build the parks, malls and highways which has increased the rate of Carbon ion the atmosphere. It was stated by the MoEF that if a 50 years old tree is cut it value for 50,000 bugs while if it left standing it will value for 25 lakhs [1]. The actual forest cover in Lucknow is about 115 square kilometers i.e., less than 5% of total area of Lucknow (2500 sq km) in 2015. It has been revealed that to build the Agra-Lucknow Greenfield Express Highways; more than 27000 tress had been axed [2,3]. There is a large felling of tress along the Raebareli road to widened the roads to accommodate increasing number of vehicles. Since the power plants and industries are stationary source of pollutants affecting air quality but in a limited area while vehicles being mobile in nature pollutes the atmosphere to a larger extent. The gases emitted from the vehicles are Carbon Monoxide, Nitrogen Oxide, Sulphur Dioxides, Suspended Particulate Matters, Hydrocarbons and Lead. In 2013, Lucknow was ranked the top most polluted city of India [4,5]. The main causes of air pollution in Lucknow are:- • Vehicular emissions and day by day increasing private vehicles on road. • Rapid urbanization on the expenditure of greenery. • Industries surrounding the city. • Unconsciousness of government and public toward this problem. 1 Res. Rev. J Ecol. Environ. Sci.| Volume 5 | Issue 3 | April - June, 2017
e-ISSN:2347-7830 p-ISSN:2347-7822 Research & Reviews: Journal of Ecology and Environmental Sciences • Burning of woods for fuel purposes. • Burning of the garbages. LITERATURE REVIEW Air Pollution is now one of the most common occurring factor resulting into threatening to human health at great extent. • Air quality of Lucknow according to analysis of last nine years air quality data shows a more or less stable trend for SO2 and a declining trend for NO2, both lying within the NAAQS. For PM10 increasing trend is seen which exceeds NAAQS (As per CPCB,2012 report). • As per report of WHO, 2014 the annual concentration of PM10 was 219 ug/m3 • As per December, 2015 AQI of Lucknow was 489. The AQI between 401 and 500 is the severe call for the human health hazard [5]. There is a high fluctuation rate in PM2.5. According to the study, it revealed that the fluctuation of the PM depends upon the wind speed and humidity of the area. If the wind speed is less than 0.3 metre/second, it leads to concentration of particulate matter. Similarly, if humidity is high, particulate matter becomes heavy and remains suspended in the air thus causing pollution. As per the record of December 2015 in Talkatora station PM2.5 recorded alarmingly at high levels on the intervening night of 9th December, 2015 Wednesday and 10th December, 2015 Thursday [6]. The highest value was 15,080 microgram per cubic metre recorded at 2.30 am on Thursday. At 11.30 pm Wednesday, PM2.5 was recorded to be at 12,641 microgram per cubic metre. The national ambient air quality standard for PM2.5 is 60 microgram per cubic metre and for PM10 is 100 microgram per cubic metre [7-11] (Figure 1). Average Pollution Level in 2015 in Lucknow 350 300 250 200 Recorded PM2.5 150 National Standard PM2.5 100 50 Estimate PM2.5 by WHO 0 Figure 1. The graph is representing the average PM2.5 emission in 2015 in Lucknow. The estimate PM2.5 by WHO is 10 while that of Yearly National Standard is 40. And the emission growth is from 90 to 290 which is a sky scraping emission and hazardous to human health. Particulate Matter 2.5 in microgram per cubic meter of different places of Lucknow Aliganj 65 Vikas Nagar 100 Indira Nagar 100 Gomti Nagar 80 Charbagh 120 Aminabad 85 Alambagh 87 Chowk 87 Amusi 87 Figure 2. The data of the pie chart is shown as that on 5th June 2015. The pie chart is demonstrating the PM2.5 of different places of Lucknow. 2 Res. Rev. J Ecol. Environ. Sci.| Volume 5 | Issue 3 | April - June, 2017
e-ISSN:2347-7830 p-ISSN:2347-7822 Research & Reviews: Journal of Ecology and Environmental Sciences Apart from the above mentioned reasons for the increasing rate of air pollution in a city, the other major factor is DIWALI CRACKERS. The fireworks and crackers during the Diwali period is also one of the cause leading to the hike in the PM2.5. As per the rate recorded during the Diwali period the PM2.5 found are as follows (Figures 2 and 3). During Normal Day PM2.5 -> 124 microgram per cubic meter On Pre-Diwali Day PM2.5-> 154 microgram per cubic meter On Diwali Day PM2.5 -> 352 microgram per cubic meter Standard level of PM2.5 -> 60 microgram per cubic meter On Post Diwali Day -> 174 mi9crogram per cubic meter Figure 3. As per the rate recorded during the diwali period the PM2.5 found are represented in the figure. PM2.5 in Central School Area PM2.5 in Talkatora Station PM2.5 in Lalbagh •331 ug/ cubic meter •Highest Level •411 ug/cubic meter •Hazardous Level •358 ug/cubic meter •Highest Level Figure 4. PM2.5 in the three crowded places of Lucknow in December 2015. The other air pollutants that too detected as hazardous for the human and for the stable functioning of the ecosystem are Ozone, Oxides of nitrogen, Oxides of Sulphur, Carbon Monoxide (Figure 4). Air Quality Index of Different Areas of the Lucknow Table 1. Lalbagh, West Lucknow, Lucknow: real time area air quality index AQI. Lalbagh, West Lucknow, Lucknow: Real Time Area Air Quality Index AQI Temp: 29°C Pollutants+Atmospheric Conditions Recorded Data PM2.5 132 ug/m Ozone 4 ug/m Nitrogen Dioxide 9 ug/m Sulphur Dioxide 3 ug/m Carbon Monoxide 9 ug/m Temperature Pressure 1000 atm Humidity Minimum Data 57 1 4 1 4 25 996 atm 72 Maximum Data 197 298 16 4 19 33 1000 100 29 94 Table 2. Talkatora, Lucknow: real time area air quality index AQI. Talkatora, Lucknow: Real Time Area Air Quality Index AQI Temp: 29°C Pollutants+Atmospheric Conditions Recorded Data PM2.5 Nitrogen Dioxide Sulphur Dioxide Carbon Monoxide Temperature Pressure Humidity Minimum Data 124 11 2 2 25 751 63 Maximum Data 191 26 9 19 33 756 99 145 16 3 6 30 754 93 3 Res. Rev. J Ecol. Environ. Sci.| Volume 5 | Issue 3 | April - June, 2017
e-ISSN:2347-7830 p-ISSN:2347-7822 Research & Reviews: Journal of Ecology and Environmental Sciences Central Pollution Control Board (CPCB) has installed online (live) air quality monitoring stations at three locations in Lucknow, Talkatora District Industrial Centre, Lalbagh Lucknow west and Central School, Aliganj. These stations monitor pollutants like particulate matter (10 and 2.5), lead, oxides of sulphur and nitrogen, hydrocarbons and carbon monoxide. AQI is the 24-hour average of the values recorded by all the stations in the city. PM2.5 and PM10 are 'invisible and ultrafine' particles (measured in micro metres) suspended in the air. The frequently measured pollutants are PM10, Sulphur Dioxide and Nitroge Dioxide (Tables 1 and 2) [12,13]. The table given below shows the Ambient Air Quality of different places in Lucknow. The comparison of 3 months’ of data of various pollutants emission has been highlighted (Tables 3-5). April 2016 Table 3. Ambient air quality of different places in Lucknow (April 2016). Industrial, Residential, Rural and other Areas Standard Data of pollutants as per NAAQS PM10 NO2 SO2 Annually 60 60 PM10 in ug/m3 231.9 228.1 309.5 290.2 269.9 271.8 276.3 24 hours 100 100 Annually 50 20 SO2 in ug/m3 24 hours 80 80 Annually 40 30 NO2 in ug/m3 28.2 28.1 25.6 28.6 30.4 27.2 29.1 24 hours 80 80 S.No 1. 2. 3. 4. 5. 6. 7. Area Sector Commercial Residential Residential Commercial Industrial Commercial Commercial Hazratganj Mahanagar Aliganj Saraya Mauli Kha Talkatora Ansal T.C. Gomti Nagar 6.8 7.0 6.9 7.1 8.2 6.3 7.2 May 2016 Table 4. Ambient air quality of different places in Lucknow (May 2016). Industrial, Residential, Rural and Areas Standard Data of pollutants as per NAAQS PM10 NO2 SO2 Annually 60 60 PM10 in ug/m3 172.2 192.7 206.8 194.1 207.3 228.5 176.7 24 hours 100 100 Annually 50 20 24 hours 80 80 Annually 40 30 24 hours 80 80 Recorded Data S.No 1. 2. 3. 4. 5. 6. 7. Area Sector Commercial Residential Residential Commercial Industrial Commercial Commercial SO2 in ug/m3 7.6 6.5 6.4 6.5 7.5 6.0 5.9 NO2in ug/m3 28 26.9 26.9 25.9 27.9 25.1 26.2 Hazratganj Mahanagar Aliganj Saraya Mauli Kha Talkatora Ansal T.C. Gomti Nagar June 2016 Table 5. Ambient air quality of different places in Lucknow (June 2016). Industrial, Residential, Rural and other areas Standard Data of pollutants as per NAAQS PM10 NO2 SO2 Annually 60 60 24 hours 100 100 Annually 50 20 24 hours 80 80 Annually 40 30 24 hours 80 80 Recorded Data S.No 1. 2. 3. 4. 5. 6. 7. Area Sector Commercial Residential Residential Commercial Industrial Commercial Commercial PM10 140.9 129.2 124.6 145.7 144.5 166.3 144.6 NO2 7.0 6.8 6.1 7.1 6.9 6.5 6.6 SO2 27.2 25.7 24.4 26.5 26.2 24.6 25.1 Hazratganj Mahanagar Aliganj Saraya Mauli Kha Talkatora Ansal T.C. Gomti Nagar 4 Res. Rev. J Ecol. Environ. Sci.| Volume 5 | Issue 3 | April - June, 2017
e-ISSN:2347-7830 p-ISSN:2347-7822 Research & Reviews: Journal of Ecology and Environmental Sciences According to IS 5182 PART-II; the Sulphur dioxide gas is measured in the ambient air and with IS 5182 PART-1V; the Nitrogen dioxide gas is measured in ambient air by Uttar Pradesh Pollution Control Board. To aware general folk about the increasing rate of air pollutants in the city, U.P PCB has established the display boards in five different places in Lucknow [14]. The equipment to measure PM5 is lacking in Lucknow city. The reply given by the Scientist Dr. Ashok Verma of U.P PCB on questioning about the reason behind the missing of the equipment was ”We are still unaware of the standard figure of PM5; so there is no use of its measurement” [15-17]. Study Area The study has been done in the crowded places of Lucknow which includes Hazratganj, Talkatora, Lalbagh, Chowk, GomtiNagar, Indira Nagar. CONCLUSION The level of the pollutants have been found increasing from the last year records. The reason found were the increase of the deforestation rate for the construction of highways and for widening roads; increase of the automobiles on road, casual nature of the folk of Lucknow and extension of the industrial sector in the outskirts of Lucknow. The exiguity of the rules, awareness programmes were found. The board is not taking a serious step towards the pollution control plan. To make the city cleaner the education among the people is the foremost step that should be taken and the formulation of the strict rules and policies. REFERENCES 1. http://www.dnaindia.com/report-lucknow-the-most-polluted-city-in-the-world-three-other 2. http://www.dnaindia.com/india/report-lucknow-the-most-polluted-city-in-the-world-three-other-indian-cities-feature-on-25- most-polluted-cities-survey-1893523 3. https://www.numbeo.com/pollution/in/Lucknow-Lakhnau 4. http://cpcbenvis.nic.in/directory/Uttar%20Pradesh%20Pollution%20Control%20Board.pdf 5. http://timesofindia.indiatimes.com/city 6. http://indianexpress.com/section/cities/lucknow/ 7. http://www.greenpeace.org/international/en/about/ 8. Ankita S, et al. Estimation of composite air quality index for Lucknow. Institute of Town Planners, India. 2010:45-46. 9. http://www.hindustantimes.com/lucknow/ 10. http://www.itpi.org.in/ 11. http://www.asianage.com/ 12. http://www.indiacom.com/yellow-pages/p-u-c--center/ 13. http://www.teriin.org/ 14. Shukla SP, et al. Air quality index for Uttar Pradesh with a focus on Lucknow. International Journal of Scientific and Innovative Research. 2015;3:134-151. 15. http://cpcbenvis.nic.in/cpcb_newsletter/AUTO%20EMISSION.pdf 16. Dipak Prasad, et al. Study of air quality and its effect on health: A geographical perspective of Lucknow city. Space and Culture, India. 2016;1:51. 17. Ankita Shukla, et al. Estimation of composite air quality index for Lucknow. Institute of Town Planners, India. 2010;7:45-56. 5 Res. Rev. J Ecol. Environ. Sci.| Volume 5 | Issue 3 | April - June, 2017