Download
1 / 43
470 likes | 796 Views
Regression Analyses II Mediation & Moderation. Review of Regression. Multiple IVs but single DV Y’ = a+b1X1 + b2X2 + b3X3...bkXk Where k is the number of predictors Find solution where Sum(Y-Y’) 2 minimized Interactions & Regression Y’ = a + b1X + b2Z + b3XZ Curvilinearity & Regression

E N D
Regression Analyses II Mediation & Moderation
Review of Regression Multiple IVs but single DV Y’ = a+b1X1 + b2X2 + b3X3...bkXk Where k is the number of predictors Find solution where Sum(Y-Y’)2 minimized Interactions & Regression Y’ = a + b1X + b2Z + b3XZ Curvilinearity & Regression Y’ = a + b1X + b2X2 + b3X3
Testing Significance of R2 Significance of R2 With df = keff and N - ktot - 1 Significance of Increment in R2 With df = k1-k2 & N - k1 - 1 k2 is subset of k1
Mediation and Moderation • Researchers often confuse • Two completely different processes and analytical approaches • Mediation - effect of an IV on DV occurs through another variable • Moderation - effect of IV on DV depends on the level of another variable
Z Y X Mediation and Moderation Indirect causal – Z is a mediator of X and Y Z X Y Moderated causal – Z is moderator of X and Y
Mediation • Implies processes or mechanisms by which an IV influences a DV • Often interpreted as “causal” mechanisms • Direct effects: Effect of IV on DV outside the mediator (c) • Indirect effects: Effect of IV on the DV through the mediator (a * b) • Total effects: Effect of IV on the DV through both indirect and direct effects (c + (a*b))
b a X M Y c Mediation • IV related to mediator (X and M: path a) • Mediator related to DV (M and Y: path b) • IV related to DV (X and Y: path c) • Relationship between the IV and DV is weakened or n.s. when mediator is controlled (X not related to Y when controlling for M: no path c when controlling for paths a and b)
b a X M Y c Steps to Test for Mediation • (1) Regress mediator on IV (test for path a) • IV must be related to mediator • beta = direct effect of X on M • (2) Regress DV on IV (test for path c) • IV must relate to DV • beta = total effect of X on Y • (3) Regress DV on both IV and mediator • Mediator must affect DV after controlling for IV • Full mediation if effect of IV disappears (beta n.s.) • Partial mediation if effect of X remains but beta is reduced but significant
Example of Mediation Work SE Positive Affect b a Job Sat c Regression #1. PA predicts WSE Beta PA = .279* Regression #2. PA predicts JS Beta PA = .463* Regression #3. PA and WSE predict JS Beta PA = .345* (compare to beta from regression #2) Beta WSE = .372* Is there evidence of mediation?
a b Y M X a b Y X M Mediation: Order of Causality • With three variable systems, difficult to determine proper causal order • Use issues of timing, logic, and theory to help determine causal order • If data collected at single point in time, not a test of causality
High Z Low Z Medium Y Z High Low High Low X Moderation • A test of moderation is a test of interaction • Multiplicative effects of IVs on a DV
Moderated & Curvilinear Effects • Enter main effects first • Significance test for increment in R2 • Interpretation of b must occur in this step • Can enter main effects all at once or one at a time • Enter curvilinear or interaction terms second • Significance test for increment in R2 • Interpretation of b must occur at point when interactions entered • Can enter in any order, but lower order must precede higher order interactions • Two-way interactions must be entered before testing three-way interactions • Curvilinear effects and interaction effects may be confounded when IVs are intercorrelated
Testing Moderation • (1) Create cross-product of two IVs; Compute XM = X * M • (2) Partial main effects first; Interpreted at Step 1 • When interaction term not included, b weights for main effects indicate “general effects” • When interaction term included, b weights for main effects indicate effect of one variable on Y when the other is zero
Slopes (1) Y’ = a + b1X + b2M + b3XM Rewritten: (2) Y’ = a + b1X + b3XM + b2M Rewritten: (3) Y’ = a + (b1 + b3M)X + b2M *You can clearly see that the value for b1 is the value when M = 0 (no moderation) so that b3M cancels out.
Y High Low X Scale Invariance b weight of X with interaction term in model Z = 0 High Z = 10 Low Z = 20
Y High Low X Scale Invariance b weight of X with interaction term in model Z = -10 High Z = 0 Z = 10 Low Now subtract 10 points from all Z scores
Lack of Scale Invariance • Why main effects are not scale invariant (1) Y’ = a + b1X + b2M + b3XM • Now, let’s subtract a constant c from X and a constant f from M and rewrite equation 1: (2a) Y’ = a + b1(X - c) + b2(M - f) + b3(X - c)(M - f) Solving: (2b) Y’ = (a - b1c - b2f + b3cf) + (b1 - b3f)X + (b2 - b3c)M + b3XM
Simple Slopes Y’ = a + b1X + b2M + b3XM Rewritten: Y’ = a + b1X + b3XM + b2M Rewritten: Y’ = a + (b1 + b3M)X + b2M You can now compute a slope for X at a given value of M. This is known as a simple slope. If you choose meaningful points for M, then you can interpret the simple slopes. That’s what the graph does for you visually.
Moderation - Interpretation • Interpretation of interactions • Simple slopes • Plotting • Plotting interactions • Continuous (pick -1 SD, mean, +1 SD) • Categorical (codes representing group)
High Z Low Z Medium Y Z High Group 1 High Low Y High Low Group 2 X Low High Low X Moderation - Interpretation
Moderation - Issues • Predictors and interaction terms will be highly correlated unless centered • The high correlation does not create problems with collinearity or interpretation (unless extremely high) b/c partial main effects first and findings are scale invariant • But if you did not partial main effects first, it would screw up the regression weights & they would not be interpretable
Moderation - Issues • Measurement error influences detection and interpretation of moderating effects • Low reliability has complex influences on tests of moderation • Testing for moderation often has low power (unreliability, error heterogeneity, etc.) • This is particularly true in field research • Small effect size (1% to 3% of variance) • Requires “X” pattern of the moderating IVs • Testing for moderation and curvilinearity together requires “filled” pattern of the moderating IVs
Do positive and negative affect interact in predicting work-family conflict? REGRESSION /MISSING LISTWISE /STATISTICS COEFF OUTS R ANOVA CHA /CRITERIA=PIN(.05) POUT(.10) /NOORIGIN /DEPENDENT wfc /METHOD=ENTER positaff negaff /METHOD=ENTER paxna .
Following up on the interaction Step 1. Regression Equation from Final Step Y’ = 13.396 + (-.197*PA) + (-.256*NA) + (.014*NA*PA) Step 2. Moderator take mean, +1SD, -1SD PA Mean = 33.06 PA +1SD = 39.82 PA -1SD = 26.30 Step 3. Insert points from last step to create 3 regression lines Mean - 13.396+(-.197*33.06)+(-.256*NA)+(.014* NA *33.06) +1SD - 13.396+(-.197*39.82)+ (-.256*NA)+(.014* NA *39.82) -1SD - 13.396+(-.197*26.30)+(-.256*NA)+(.014* NA * 26.30) Reduces: Y’ = 6.88 + (.207*NA) Y’ = 5.55 + (.557*NA) Y’ = 8.22 + (.368*NA)
Following up on the interaction • Plot the following lines Y’ = 6.88 + (.207*NA) [Mean] Y’ = 5.55 + (.557*NA) [+1] Y’ = 8.22 + (.368*NA) [-1] • Useful to choose several points on line • Interpret
Interaction Effects • Presence of interactions qualifies the interpretation of main effects • Presence of higher order interactions qualifies the interpretation of lower order interactions • df are used up quickly as more potential interactions are added • Interpreting interactions with more than 3 variables is very difficult
Z M X Y Moderation/Mediation Models • Testing mediation & moderation models together • If Z is a categorical variable, can test model using multiple groups analysis in SEM • If Z is continuous, can test model using special SEM models, but very difficult
Z M X Y Moderation/Mediation Models (1) Enter X, enter Z, enter XZ, enter M, enter MZ • If increment R2 for neither XZ nor MZ significant, no evidence for moderation • If MZ significant, suggests moderated mediation (MM) • If MZ not significant after controlling for XZ, but XZ is signif, then suggests XZ has direct moderating effect (not mediated through MZ) (2) Enter M, enter Z, enter MZ, enter X, enter XZ • If MZ significant, and XZ was signif in step 1 but no longer signif here, suggests MM • If MZ not signif, no evidence for MM
Curvilinearity X Low High X Medium • Curvilinearity can be considered moderation of a variable by itself • Tested the same way as moderation • Most of the same issues regarding moderation apply to curvilinearity Y X High Low High X Low
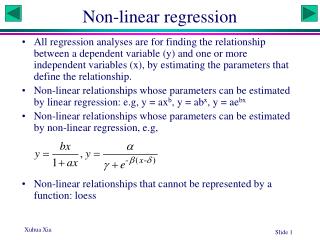
Non-linear regression • Nonlinear relationships. • The quadratic effect of Publications: Publications2 • This new variable would be tested after original variable, Publications, had been entered. • Publications2 is just the product of Publications with itself. It looks like any other product used to test an interaction. How can this variable be interpreted as an interaction?
What would a significant quadratic effect of publications mean in addition to a significant linear effect?
A quadratic effect indicates that the linear relation between a variable and the outcome changes slope across levels of the variable.
Syntax to Examine Residuals REGRESSION /DESCRIPTIVES MEAN STDDEV CORR SIG N /MISSING LISTWISE /STATISTICS COEFF R CHA ANOVA COLLIN TOL /NOORIGIN /DEPENDENT y /METHOD=ENTER x /RESIDUALS /CASEWISE ALL ZRESID SRESID LEVER COOK /SCATTERPLOT=(*RESID ,y) (*RESID, x) (*ZRESID,*ZPRED )
Syntax Polynomial Regression REGRESSION /DESCRIPTIVES MEAN STDDEV CORR SIG N /MISSING LISTWISE /STATISTICS COEFF R CHA ANOVA COLLIN TOL /NOORIGIN /DEPENDENT y /ENTER x /ENTER x2 /RESIDUALS /CASEWISE ALL ZRESID SRESID LEVER COOK /SCATTERPLOT=(*RESID ,y) (*RESID, x) (*ZRESID,*ZPRED ) Block Number 2. Method: Enter X2
Variable(s) Entered on Step Number 1.. X Multiple R .11435 R Square .01308 R Square Change .01308 Adjusted R Square -.00748 F Change .63597 Standard Error 40.06215 Signif F Change .4291 Block Number 2. Method: Enter X2 Variable(s) Entered on Step Number 2.. X2 Multiple R .98170 R Square .96374 R Square Change .95066 Adjusted R Square .96220 F Change 1232.26856 Standard Error 7.76022 Signif F Change .0000


![[Insert faculty Banner] Consistency of Moderation](https://cdn0.slideserve.com/1458900/insert-faculty-banner-consistency-of-moderation-dt.jpg)