Download
1 / 16
160 likes | 317 Views
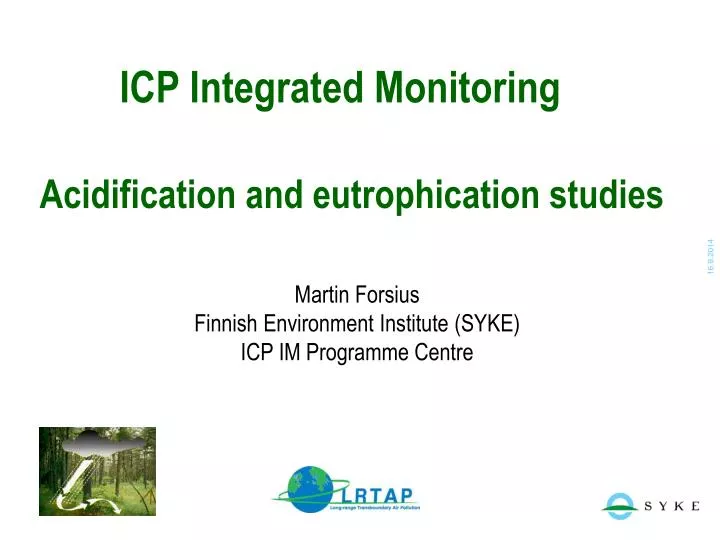
ICP Integrated Monitoring Acidification and eutrophication studies. Martin Forsius Finnish Environment Institute (SYKE) ICP IM Programme Centre. Main tasks. Assessment of relationships between critical load exceedances and empirical impact indicators at ICP IM sites

E N D
ICP Integrated Monitoring Acidification and eutrophication studies Martin Forsius Finnish Environment Institute (SYKE) ICP IM Programme Centre
Main tasks • Assessment of relationships between critical load exceedances and empirical impact indicators at ICP IM sites • Biodiversity assessment – Literature review and first data analyses
Background • European databases and maps of critical loads have been instrumental in effect-based protocols to the UNECE CLRTAP. • For testing and validation of the key concepts in the critical load calculations, it is important to study the link between critical thresholds of acidification and eutrophication of the ecosystems and empirical impact indicators.
Studysites: European IM network 1) Calculate the site-specificcritical loads for acidification and eutrophication for aquatic and terrestrialecosystems, and their exceedances (ExCL) 2) and present relationships betweenExCL and surface water chemistrymeasurements at 18-24 European ICP IM sites
Materials and methods 1/3 • Mass balance critical loads • Acidification CLA: Steady State Water Chemistry (SSWC) (Henriksen and Posch 2001, UBA 2004) • EutrophicationCLnutN:Mass Balance model for nutrient nitrogen (UBA 2004) • For a selection of 18 IM sites from 10 countries (AT, CZ, DE, EE, FI, GB, LT, LV, NO, SE) for which runoff water chemistry and runoff measurement data were available • Exceedances: deposition estimates at IM sites ExCLA = S depNAT2000 – CLA ExCLnutN = N depNAT2000 – CLnutN
Materials and methods 2/3 • CL for eutrophication: empirical critical load of nutrient nitrogen CLempN (Bobbink and Hettelingh 2011) • Based on empirical studies on the response of natural and semi-natural ecosystems to nitrogen deposition. • CLempN are given for a groups of ecosystems, classified according to the EUNIS-European Nature Information System- habitat classification for Europe • 24 IM sites • Exceedances: ExCLempN = N dep NAT2000 - CLempN
Materials and methods 3/3 • Empirical impact indicators • Acidification: annual average runoff water concentrations and fluxes in the period 2000-2002 for key acidification parameters such as Acid Neutralising Capacity ANC = (Ca+Mg+Na+K) – (SO4+Cl+NO3), hydrogen-ion (H+) and non-marine sulphate (xSO4), • and eutrophication: total inorganic nutrient nitrogen (TIN = NO3+NH4)
ExCL: nr of sitesprotected/notprotected in 2000(NAT2000 projection) ExCLA ExCLnutN ExCLempN
GoodagreementbetweenExCLA and ANC and H+ Conc. -cc 0.63 p < 0.05 -cc -0.67 p < 0.05 Flux -cc 0.60 p < 0.05 -cc -0.84 p < 0.05
ExCLnutN / ExCLempN vs. TIN (NO3 + NH4) Conc. -cc 0.61 p < 0.05 Flux -cc 0.35 p < 0.1
Concludingremarks on CL studies • At the majority of the IM sites (72%), CLA was not exceeded • Instead, CLempN and CLnutN were exceeded at 7578% of the sites • There was a relatively good agreement between ExCLA and ANC and H+ in runoff water • Leaching of N was higher for sites with higher ExCLempN and ExCLnutN • Evidence on the link between modelled critical thresholds and empirical impact indicators • Scientific paper in preparation, updated results will also be used for WGE ex-post scenario analyses
Biodiversity assessment • Review of published results from monitoring and analyses made within the ICP IM subprogrammes Trunk epiphytes (EP), Aerial green algae (AL), Understory vegetation and trees on intensive plots (VG) and Vegetation structure and species cover (VS). • Preliminary results of data analyses. • Results presented in ICP IM Annual Report 2011.
Relationship between significant time trends of forest floor species and Ellenberg indicator values N (nutrient availability), R (soil pH), L (light availability), F (moisture)
Concluding remarks on biodiversity studies • Lichens in high pollution regions in central Europe are more affected than in the Nordic countries. • Algae or lichens differ in their suitability as indicators. At low deposition sites, algae may be more suitable as indicator than lichens. • Species changes are highly variable between sites. The found significant changes are restricted to few species and the relationship with air pollution is not very clear. • Further analyses will focus on community changes and changes of diversity using indicators. The results will again be compared with CL exceedance.