Download
1 / 13
130 likes | 210 Views
Problem 5.2. Rational and irrational subgrouping. Sources of variation. Different Parts Location within Part (Left, Right or Middle) Position ( 1 through 8). Within and Between term.

E N D
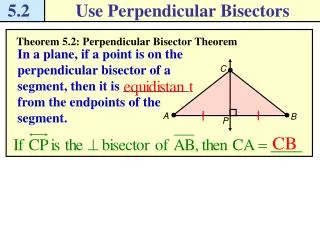
Problem 5.2 Rational and irrational subgrouping
Sources of variation • Different Parts • Location within Part (Left, Right or Middle) • Position ( 1 through 8)
Within and Between term The within subgroup term(s) determine what we think our estimate of Common Cause is. In general, we should try to choose our subgroups so that the within subgroup variation term(s) have the smallest variation. This make our charts the most informative.
Subgroup plan 1 • Subgroup by Part. • Eight values per subgroup. • Each position represented within each subgroup. • Position is our within subgroup source of variation and will determine our estimate of Common Cause.
White space • Where did the white space come from? • So we should…….?
Strategy 2: Now use Location (L,M,R) as subgroups for each Part
Strategy 3 • Maybe Position has the most variability. • Make Position the Between subgroup term. • Make Part the Within subgroup term. • The variability of each Position within the Parts will now give us our estimate of Common Cause.