Download
1 / 50
500 likes | 626 Views
The Representation of Extratropical Cyclones in HiGEM. Jennifer Catto Supervisors: Len Shaffrey – NCAS Climate and Kevin Hodges - ESSC. Motivation – Importance of Extratropical Cyclones. Huge socioeconomic impacts Strong winds and heavy precipitation

E N D
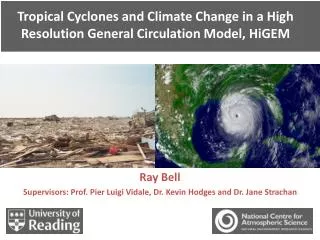
The Representation of Extratropical Cyclones in HiGEM Jennifer Catto Supervisors: Len Shaffrey – NCAS Climate and Kevin Hodges - ESSC
Motivation – Importance of Extratropical Cyclones • Huge socioeconomic impacts • Strong winds and heavy precipitation • Important for large-scale flow in transporting heat and moisture, • Want to be able to forecast how they will change in the future. 3rd February 2009
Motivation – High Resolution Climate Modelling • Higher resolution atmosphere models should be able to represent structures of storms better – e.g. fronts, distribution of precipitation. • For regional climate studies including hazards and impacts need higher resolution. • Higher resolution ocean gives better representation of Gulf Stream and Kuroshio current – impacts on baroclinicity. HiGEM HadGEM
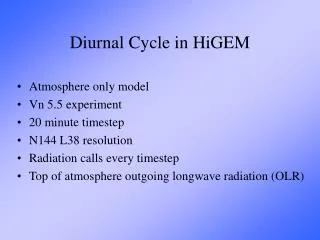
Introduction to HiGEM • HiGEM • Based on HadGEM1 – the Met Office coupled climate model • 1.25° lat x 0.83° lon in atmosphere (N144) • 38 vertical levels in the atmosphere • 1/3° x 1/3°in the ocean, 40 levels • HadGEM • 1.875° lat x 1.25° lon in atmosphere (N96) • 38 vertical levels in atmosphere • 1° x 1° in the ocean going to 1° x 1/3° at the equator • ERA-40 • 45 years of global gridded data • Approximately 1.1° x 1.1° resolution (110km) • ERA-Interim • New reanalysis from ECMWF • Approximately 80km resolution • Uses 4DVAR
Outline • Climatology • Eulerian Statistics • Objective Feature Tracking • SST experiment • Structure • Compositing • Future Climate Predictions • Conclusions
Eulerian Statistics – 250hPa TEKE and where are the 2-6 day bandpass filtered winds. 2-6 day bandpass Transient Eddy Kinetic Energy (m2s-2) ERA-40 HiGEM
Eulerian Statistics – 250hPa TEKE 2-6 day bandpass Transient Eddy Kinetic Energy (m2s-2) ERA-40 HadGEM
Eulerian Statistics – MSLP variance 2-6 day bandpass filtered standard deviation of MSLP (hPa) ERA-40 HiGEM
Eulerian Statistics – MSLP Variance 2-6 day bandpass filtered standard deviation of MSLP (hPa) ERA-40 HadGEM
Objective Feature Tracking • Frequently used method to investigate extratropical cyclone activity • Using Kevin Hodges Feature tracking method described in Hoskins and Hodges (2002) • Fields filtered to T42 and background field - (wavenumber ≤ 5) removed • Once tracks are found they are referenced back to full resolution for further analysis • Vorticity preferred for tracking as it picks up more small scale features and is not an extrapolated field.
NH Tracking Statistics – Genesis Density Genesis density – cyclones per month per 5° spherical cap. ERA-40 HiGEM • HiGEM captures main features of cyclogenesis over Gulf Stream and Kuroshio current although there is too much cyclogenesis over the Pacific.
NH Tracking Statistics – Genesis density Genesis density – cyclones per month per 5° spherical cap. HadGEM ERA-40 • HadGEM also captures main features of cyclogenesis with roughly the right amount of cyclogenesis over the Kuroshio but slightly less than ERA-40 in the mid-Pacific.
NH Tracking Statistics – Track Density Track density – cyclones per month per 5° spherical cap. ERA-40 HiGEM
NH Tracking Statistics – Track Density Track density – cyclones per month per 5° spherical cap. ERA-40 HadGEM
NH PDFs of cyclone strength - vorticity • More extreme high vorticity events in HiGEM compared to ERA-40 and HadGEM. • HadGEM compares very well with lower resolution reanalysis – ERA-40. • HiGEM compares very well with higher resolution reanalysis – Interim.
NH PDFs of cyclone strength – 925hPa wind speeds • Wind speed affected less by resolution than vorticity. • Higher wind speeds seen in storms in HiGEM than in other datasets.
SST Experiment HiGAM - HiGEM HiGEM • Comparing HiGEM and HiGAM (atmosphere only run using AMIP2 SSTs). • HiGAM doesn’t have big excess of cyclones in Pacific.
SST Experiment • Cold bias in North Pacific leading to increased SST gradient in Kuroshio current.
SST experiment • Constant mean DJF anomaly applied to AMIP2 SSTs. • Ensemble of 20 winters (October to March) of atmosphere only model run.
HiGAM SST experiment - Results SST anom HiGAM • Genesis region shifts further off coast of Japan when SST anomaly is included. • Maximum genesis in this region has not changed.
HiGAM SST experiment - Results SST anom HiGEM • Still large differences in genesis in this region. • Need to consider advection of moisture, upper level seeding of cyclones.
Summary Transient eddy kinetic energy represented well by models. MSLP variance looks similar between datasets but does not show up Mediterranean storm track. Genesis density and track density well represented in HiGEM and HadGEM. The tighter SST gradient in the Kuroshio current impacts the position but not strength of the cyclogenesis. Large impact of resolution on the maximum vorticity and 925hPa wind speeds of the storms HiGEM very similar to ERA-Interim HadGEM very similar to ERA-40
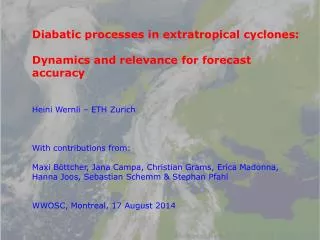
Storm Structure • Representing storm structures in climate models is very important for producing believable future predictions • Do the storms represent the key features of extratropical cyclones? • Structures important for regional climate impacts – strong winds and heavy precipitation have large socioeconomic impacts. • Need a statistical way to compare the structure of storms from HiGEM and ERA-40
Previous composite studies Field & Wood 2007 Composite over all features at all times (for 400 features over 2 years). Doesn’t distinguish between different times in lifecycle. Wang & Rogers 2001 Compositing explosive cyclones in different regions of the Atlantic. Composites taken at different times. Don’t take into account direction of propagation of storms.
Composite Analysis - Methodology • Step 1: Identify tracks using Kevin’s tracking program
Composite Analysis - Methodology • Step 2: Choose at what stage in the lifecycle to composite the tracks e.g. • Maximum tendency • Maximum intensity • Maximum precipitation • Minimum pressure • and identify where this occurs
Composite Analysis - Methodology • Step 3: Extract the 20o radius around this point and note the direction of propagation of the storms.
Composite Analysis - Methodology • Step 4: Rotate these areas to the same direction of propagation and average them. + + =
Composite Analysis – Positions of tracks • Position of 50 of the tracks used for the composites and the point at which the maximum intensity occurs.
Composite Analyses – Surface Features Colours – 850hPa equivalent potential temperature (K) (anomaly from area average) ERA-40 HiGEM
Composites Analysis – Surface Features Colours – 925hPa wind speed (ms-1) HiGEM ERA-40
Results – 925hPa horizontal winds A Colours – system relative wind speed (ms-1) B ERA-40
Results – 400hPa horizontal winds A Colours – system relative wind speed (m/s) B ERA-40
Results – vertical slice along WCB WCB A B CCB A ERA-40 B
Results – vertical slice along WCB B A A ERA-40 B
Results – 925hPa horizontal winds A A Colours – system relative wind speed (ms-1) B B ERA-40 HiGEM
Results – 400hPa horizontal winds A A Colours – system relative wind speed (m/s) B B ERA-40 HiGEM
Results – vertical slice along WCB WCB WCB CCB CCB HiGEM ERA-40 CCB CCB • Isentropes slightly shallower in HiGEM
Results – vertical slice along WCB HiGEM ERA-40 • Very similar wind and temperature fields • Differences in structure of RH • Possibly more convection triggered along WCB in HiGEM than ERA-40
Results – 500 hPa vertical winds A A Colours – vertical velocity (hPa/hour) B B HiGEM ERA-40
Results – 500hPa Relative Humidity Relative Humidity at 500hPa (%) ERA-40 HiGEM
Results – Vertical Slice along Dry Intrusion A B A B HiGEM ERA-40 • Slope of isentropes very similar between HiGEM and ERA-40. • Weaker along isentropic wind speeds in HiGEM consistent with weaker descent behind the cyclone.
Summary • Compositing method capable of producing composite cyclones that show the key features of conceptual models – CCB, WCB, dry intrusion. • These features compare well between HiGEM and ERA-40. • There are some differences in the vertical structure of moisture indicating that diabatic processes are handled differently in HiGEM and ERA-40.
Future Predictions • Bengtsson et al 2006 • Northwards shift of storm track • Increase of storms over UK • A lot fewer tracks over Mediterranean • Track density difference between 2071-2100 and 1971-2000 for A1B scenario – ECHAM5
Future Predictions 2 X CO2 - Control 4 X CO2 - Control Track density – cyclones per month per 5° spherical cap.
Future Predictions Distributions of wind speed for NH
The storm tracks in HiGEM and HadGEM compare well with ERA-40 although there are some differences that have yet to be understood. The storms in HiGEM and the Interim reanalysis have higher maxima in vorticity than HadGEM and ERA-40. The compositing methodology provides a novel way of looking statistically at the structure of cyclones. Using conceptual models to guide the analysis, HiGEM does a very good job of representing the structures of extratropical storms when compared to ERA-40. There are some differences in the vertical structure of moisture in the composites, indicating that diabatic processes are handled differently in HiGEM and ERA-40. Initial results from the 2X and 4X CO2 experiments show some consistency with other studies. Large reductions in track density over Mediterranean, Northwards shift. Conclusions
Further Questions SST Experiment What impact do the changed SSTs have on other aspects of the atmospheric flow? Compositing Will the results found here be robust over other climate models? Will the results be the same for HadGEM? Would an isentropic analysis yield the same results? Future Predictions How do the storm structures change in the 2x and 4x CO2 experiments? Are there stronger winds in the most extreme storms?
Thanks! j.l.catto@reading.ac.uk www.met.rdg.ac.uk/~swr06jlc