Download
1 / 23
230 likes | 370 Views
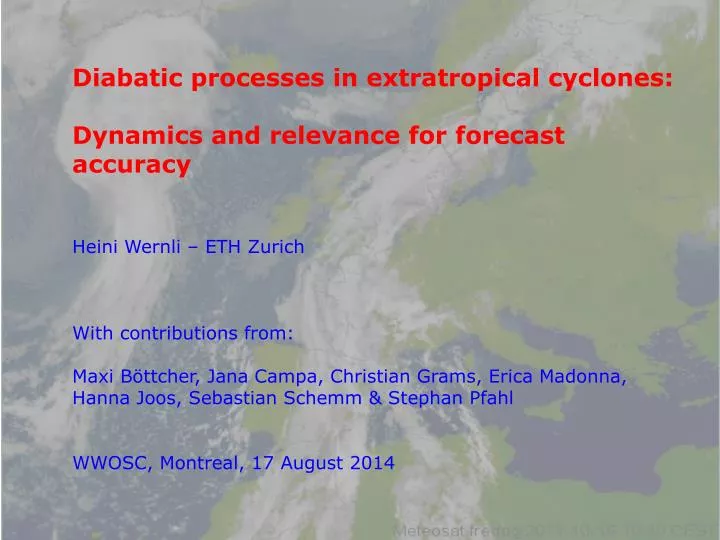
Diabatic processes in extratropical cyclones: Dynamics and relevance for forecast accuracy Heini Wernli – ETH Zurich With contributions from: Maxi Böttcher, Jana Campa , Christian Grams, Erica Madonna, Hanna Joos, Sebastian Schemm & Stephan Pfahl WWOSC, Montreal, 17 August 2014.

E N D
Diabatic processes in extratropical cyclones: Dynamics and relevance for forecast accuracy HeiniWernli – ETH Zurich With contributions from: Maxi Böttcher, Jana Campa, Christian Grams, Erica Madonna, Hanna Joos, Sebastian Schemm & Stephan Pfahl WWOSC, Montreal, 17 August 2014
How do diabatic processes impact mid-latitude flow and its prediction? Use ECMWF datato show that diabatic PV production in low troposphere is essential for the formation of intense extratropical cyclones diabatic processes are particularly intense in so-called warm conveyor belts (WCBs) major part of precipitation extremes occurs with WCBs poor medium-range weather forecasts are often associated with errors in the representation of WCBs accuracy in predicting the intensity and location of WCBs has improved for the ECMWF high-resolution model in last 10 y
Diabatic PV modification • Diabatic heating (condensation of water vapour, freezing of cloud droplets, evaporation of hydrometeors, radiative processes, …) • leads to modification of PV: • Essential are • - absolute vorticity value • vertical gradient of diabatic heating rate (not the heating itself) • PV production mainly in lower troposphere • PV destruction mainly in upper troposphere
Diabatic PV productionis essential forintensecyclones Historicexamplesof„PV towers“ „October Storm“ „PresidentDay‘s Storm“ (UK, October 1989) (USA, February 1979) Hoskins andBerrisford1991 (Weather)Whitackeret al. 1988 (MWR)
Diabatic PV productionis essential forintensecyclones Climatologyof PV anomalyprofile in maturecyclones intensecyclonesweakcyclones SLP: 930-970 hPa990-1010 hPa Intensecyclones: stronger PV anomaliesbothin uppertroposphere (adiabaticdescent) & lowertroposphere (diabatic production) Campa and Wernli 2012 (JAS)
Diabatic processesareparticularlyintense in WCBs Characteristicsof warm conveyorbelts: within 2 days: - ascent> 600 hPa - polewardtransport > 3500 km - latent heating > 20 K - intenseprecipitation pressure (hPa) Joos and Wernli 2012 (QJ)
Major partofprecipitation extremes occurswith WCBs Precipitation extremes (>99 percentile) associatedwithWCBs Pfahl et al. 2014 (J Clim)
Diabatic processesareparticularlyintense in WCBs Characteristicsof warm conveyorbelts: within 2 days: - ascent> 600 hPa - polewardtransport > 3500 km - latent heating > 20 K - intenseprecipitation in theoutflow: - low PV (<0.5 pvu) - strongly neg. PV anomaly pressure (hPa) Joos and Wernli 2012 (QJ)
Diabatic processesareparticularlyintense in WCBs (Very) low PV values in WCB outflownearjetstream jet stream PV (pvu) on 310 K WCB outflow Joos and Wernli 2012 (QJ)
Diabatic processesareparticularlyintense in WCBs PV difference at 316 K of moist-dry baroclinic wave simulation PV difference of -2.5 pvu in WCB outflow PV difference of +2 pvu in downstream trough Schemm et al. 2013 (JAS)
Poor 3-7 day fc associated with errors in WCBs PV forecast errors typically occur near extratropical jet stream Dirren et al. 2003 (GRL), Davies and Didone 2013 (MWR), Gray et al. 2014 (GRL) Here: look at particular forecast bust on 12 UTC 13 Jan 2005 + 5 days SLP average over Central Europe analysis 1003 hPa deterministic fc 1024 hPa ! EPS 1012 – 1037 hPa !!
Poor 3-7 day fc associated with errors in WCBs • analysis at day 5: • large-amplitude wave over North Atlantic • pronounced trough and low SLP over Central Europe ana +5 PV on 320 K T1 R1
Poor 3-7 day fc associated with errors in WCBs • forecast at day 5: • zonal flow over N Atlantic • high SLP over C Europe ana +5 PV on 320 K T1 R1 fc +5 T1 R1
Poor 3-7 day fc associated with errors in WCBs ana +5 ana +3.5 PV on 320 K T1 R1 T1 R1 fc +3.5 fc +5 T1 T1 R1 R1
Poor 3-7 day fc associated with errors in WCBs • Feature-basedverificationof WCBs in ECMWF forecasts • Consider 3 aspectsoferror in predicting WCB outflow: • Pstrengthof negative PV anomaly • Aamplitudeof WCB (numberoftrajectories) • Llocationof WCB outflow • perfectforecast: P = A = L = 0 • similarto SAL verificationofprecipitationforecasts • (Wernli et al. 2008, MWR) Madonna et al., in review (QJ)
Poor 3-7 day fc associated with errors in WCBs Exampleforapplicationof PAL WCB trajectories WCB outflowobjects analysis P = -0.28 A = -0.41 L = 0.10 forecast
Poor 3-7 day fc associated with errors in WCBs • Forecasts withlow ACC canbeassociatedwith WCB errors • Example: • ACC ofln(PV) in North Atlantic= 0.32 atday 5 ! • forcastsmissedrepresentationof WCB • completelywrong Rossby wavepatternover N Atlantic analysis forecast PV@320K
Poor 3-7 day fc associated with errors in WCBs PAL diagramfor WCBs in 0-2 dayforecastsin DJF 2010/2011 Madonna et al., in review (QJ)
Poor 3-7 day fc associated with errors in WCBs PAL diagramforWCBs in 3-5 dayforecastsin DJF 2010/2011 Madonna et al., in review (QJ)
Predictionof WCBs hasimprovedduring last 10 years Statisticsof WCB amplitudeforforecasts in 2010/11 0-2 d fc 1-3 d fc 2-4 d fc 3-5 d fc
Predictionof WCBs hasimprovedduring last 10 years Statisticsof WCB amplitudeforforecasts in 2002/03 and 2010/11 0-2 d fc 1-3 d fc 2-4 d fc 3-5 d fc Madonna et al., in review (QJ)
More aboutthesetopicsat WWOSC! Aircraftmeasurements in WCBs Andreas Schäfler (Poster, Sun 15:00) Link between PV modification in WCBs andcloudmicrophysics Hanna Joos (Mon 17:20) Bas Crezee (Poster, Mon 15:00) WCBs and extreme precipitation & flooding Christian Grams (Wed 10:30) Diabatic Rossby wavesand explosive cyclones Maxi Böttcher (Wed 14:20) Howdoes latent heating in WCBs affectcyclones? Hanin Binder (Poster, Wed 15:00)
Conclusions Mid-latitudeflowisstronglyinfluencedby diabatic processes (e.g., in WCBs) look in detail at link between microphysics and dynamics Poor forecast performance is in cases related to errors in representation of diabatic processes (e.g., latent heating in WCBs) Need toperformdedicatedfieldexperimentstoconstrainmodels(e.g., T-PARC, DIAMET, T-NAWDEX/DOWNSTREAM, ...) from Pat Harr