Download
1 / 28
280 likes | 451 Views
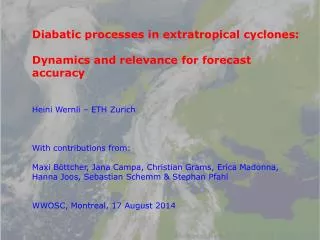
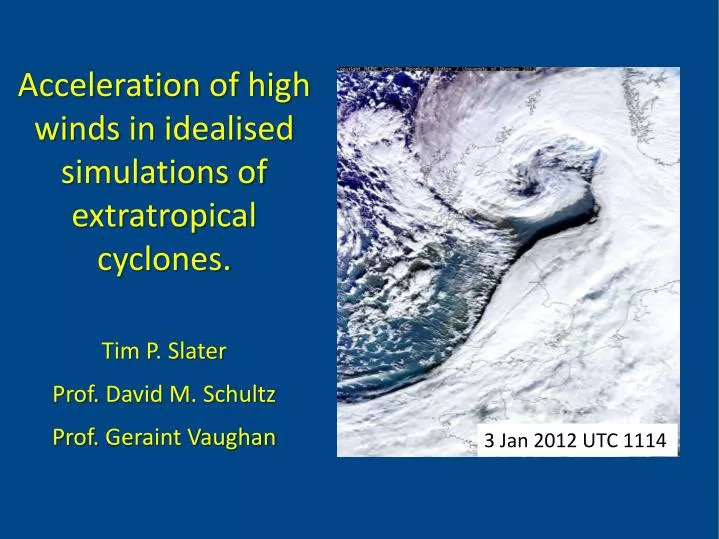
Acceleration of high winds in idealised simulations of extratropical cyclones. Tim P. Slater Prof. David M. Schultz Prof. Geraint Vaughan. 3 Jan 2012 UTC 1114. Widespread residential damage,. Windstorm Klaus (2009) > 1 billion euros. (BBC). …. blown down trees and flooding .

E N D
Acceleration of high winds in idealised simulations of extratropical cyclones. Tim P. Slater Prof. David M. Schultz Prof. Geraint Vaughan 3 Jan 2012 UTC 1114
Widespread residential damage,... Windstorm Klaus (2009) > 1 billion euros (BBC)
…. blown down trees and flooding. Windstorm Xynthia (2010) 65 deaths (presseurop) (presseurop) www.ideal-homes.org.uk (The Great Storm of 1987: 20 year retrospective)
What is the distribution of high winds in an extratropical cyclone?Why does this distribution exist?
Start simple! Horizontal Windspeed (thick black) Temperature (thin black) • Idealised, baroclinic wave using Weather Research and Forecasting (WRF) model. Pressure (hPa) • Initialisation by 1K perturbation to jet on a f-plane in thermal wind balance . Distance (km)
Start simple! • Dry • 20 km grid-spacing • Where are the high winds?
Day 4.75 ms-1 Potential temperature (thin black) Distance (km) Distance (km) Horizontal wind (shaded) Pressure (thick black) Potential temperature (thin black)
Day 5.25 Potential temperature (thin black) ms-1 Distance (km) Distance (km) Horizontal wind (shaded) Pressure (thick black) Potential temperature (thin black)
Day 5.75 Potential temperature (thin black) ms-1 Distance (km) Distance (km) Horizontal wind (shaded) Pressure (thick black) Potential temperature (thin black)
Day 6.25 Potential temperature (thin black) ms-1 Distance (km) Distance (km) Horizontal wind (shaded) Pressure (thick black) Potential temperature (thin black)
Windspeed increases before pressure gradient increases.Peak in windspeeds after peak in maximum pressure gradient. MinimumCentral Pressure Maximum Horizontal Wind Maximum Pressure Gradient
Can create acceleration/force vectors from model output. To understand increases in windspeed look at along-flow accelerations. Velocity Pressure gradient force Coriolis force Vertical advection Horizontal advection Friction
Day 4.75 ms-1 System-relative wind (shaded) Potential temperature (thin black) Vertical velocity (thick black, negative dotted) Along-flow acceleration by pressure gradient (blue) L Distance (km)
Day 4.75 ms-1 System-relative wind (shaded) Potential temperature (thin black) Vertical velocity (thick black, negative dotted) Along-flow acceleration by pressure gradient (blue) and vertical advections (red) L Distance (km)
Day 5.25 ms-1 System-relative wind (shaded) Potential temperature (thin black) Vertical velocity (thick black, negative dotted) Along-flow acceleration by pressure gradient (blue) L Distance (km)
Day 5.25 ms-1 System-relative wind (shaded) Potential temperature (thin black) Vertical velocity (thick black, negative dotted) Along-flow acceleration by pressure gradient (blue) and vertical advections (red) L Distance (km)
Day 5.75 ms-1 System-relative wind (shaded) Potential temperature (thin black) Vertical velocity (thick black, negative dotted) Along-flow acceleration by pressure gradient (blue) L Distance (km)
Day 5.75 ms-1 System-relative wind (shaded) Potential temperature (thin black) Vertical velocity (thick black, negative dotted) Along-flow acceleration by pressure gradient (blue) and vertical advections (red) L Distance (km)
Day 6.25 ms-1 L System-relative wind (shaded) Potential temperature (thin black) Vertical velocity (thick black, negative dotted) Along-flow acceleration by pressure gradient (blue) Distance (km)
Day 6.25 ms-1 L System-relative wind (shaded) Potential temperature (thin black) Vertical velocity (thick black, negative dotted) Along-flow acceleration by pressure gradient (blue) and vertical advections (red) Distance (km)
Day 5.75 Potential temperature (thin black) ms-1 Distance (km) Distance (km) Horizontal wind (shaded) Pressure (thick black) Potential temperature (thin black)
Windspeed (ms-1) Pressure (hPa) Day 5.75 Colours – Starting heights Red 850-900 hPa Pink 900-950 hPa Green 950-1000 hPa Pressure Gradient(ms-2) Vertical Vel. (cms-1)
Day 5.75 Potential temperature (thin black) ms-1 Distance (km) Distance (km) Horizontal wind (shaded) Pressure (thick black) Potential temperature (thin black)
Windspeed (ms-1) Pressure (hPa) Day 5.75 Colours – Starting heights Green 950-1000 hPa Orange 1000-1050hPa Pressure Gradient(ms-2) Vertical Vel. (cms-1)
Momentum equations are a useful tool for studying the development of the high winds within an extratropical cyclone.Pressure gradient creates momentum ahead of warm front.Vertical advections transport high wind from aloft that is accelerated on descent as a result of the pressure gradient. Conclusions