Download
1 / 16
160 likes | 287 Views
Modelling of salinity and temperature variation in the Baltic Sea during the last two decades S. Miladinova and A. Stips. Model set-up. GETM ( www.getm.eu ) Topography 1 nm by 1nm ( www.io-warnemuende.de/topography-of-the-baltic-sea.html )

E N D
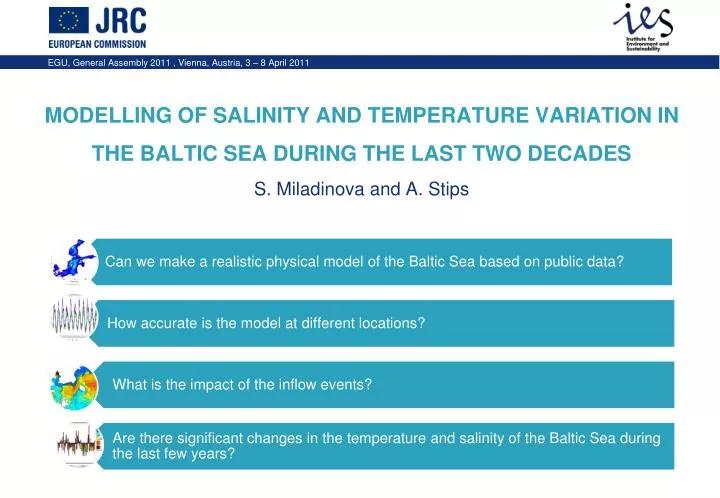
Modelling of salinity and temperature variation in the Baltic Sea during the last two decadesS. Miladinova and A. Stips
Model set-up • GETM (www.getm.eu) • Topography 1 nm by 1nm (www.io-warnemuende.de/topography-of-the-baltic-sea.html) • Sea level variations at the open boundary (www.dmi.dk/dmi/tr07-09; www.ioc-sealevelmonitoring.org) • Runoff from land (different sources ) • Meteorological forcing (www.ecmwf.int) • Initial and boundary conditions for salinity and temperature (Janssen et al. (1999); nest.su.se/bed)
Model domain • Horizontal grid - 628 x 371 (cells of 1 nm by 2 nm); • 25 vertical layers of adaptive terrain-following coordinates; • Time step: 25 s for the barotropic and 750 s for the baroclinic mode; • Calculations are distributed to 48 processes; • The run is carried out on 4 clusters with 12 CPUs; • About 20 CPUs minutes for a month; • 25 year run (1986–2010).
Difference between observed and modeled daily mean sea levels at Landsort
Model verification at Anholt station (1986 – 2010) Correlation coefficient = 0.92 RMSD = 2.8 Standard deviation = 1.2 Correlation coefficient = 0.95 RMSD = 1.5˚C Standard deviation = 1
Model verification at Bornholm station Correlation coefficient = 0.84 RMSD = 2.4 Standard deviation = 0.83 Correlation coefficient = 0.82 RMSD = 2.7˚C Standard deviation = 1
Model verification at LL7 station Correlation coefficient = 0.84 RMSD = 0.77 Standard deviation = 1.5 Correlation coefficient = 0.89 RMSD = 2.6˚C Standard deviation = 1
Recent inflow events (2006 – 2008) Drogden Sill barotropic inflow baroclinic inflow Darss Sill Short Info for the inflow events http://www.io-warnemuende.de
Bottom and surface salinity at Bornholm during the last 5 years
Mean surface/bottom temperature in comparison to the mean values of the last 25 years At the surface At the bottom
Conclusions • The model is capable to reproduce reasonably the Baltic inflow events; • Better calculation of the near bottom temperature in the deep regions is crucial; • Higher inflow activity is detected; • Frequent occurrence of moderate/minor barotropic and baroclinic inflow events ventilate “continuously” the Borholm Deep and the Gdansk Deep;
Acknowledgements: • We are grateful to the Baltic Nest Institute, Stockholm University for making available the hydrographic data trough the Baltic Environmental Database. • Special thanks are given to the GETM developers for providing and maintaining the model, and in particular to Richard Hofmeister for developing and implementing the adaptive vertical coordinates. • Info: • The monthly mean hydrodynamical model results will be uploaded on the Environmental Marine Information System (http://emis.jrc.ec.europa.eu)