Download
1 / 1
10 likes | 95 Views
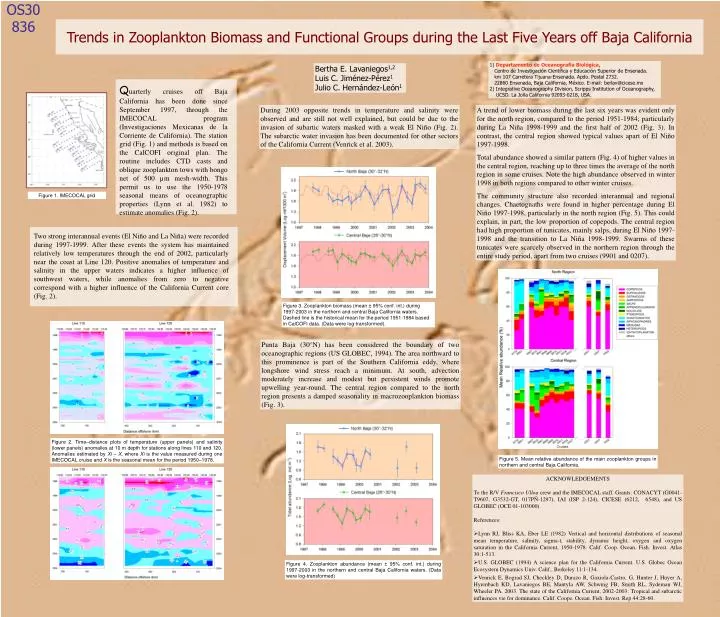
OS30 836. Figure 1. IMECOCAL grid.

E N D
OS30 836 Figure 1. IMECOCAL grid Figure 2. Time–distance plots of temperature (upper panels) and salinity (lower panels) anomalies at 10 m depth for stations along lines 110 and 120. Anomalies estimated by Xi – X, where Xi is the value measured during one IMECOCAL cruise and X is the seasonal mean for the period 1950–1978. Figure 5. Mean relative abundance of the main zooplankton groups in northern and central Baja California. Figure 4. Zooplankton abundance (mean ± 95% conf. int.) during 1997-2003 in the northern and central Baja California waters. (Data were log-transformed) Trends in Zooplankton Biomass and Functional Groups during the Last Five Years off Baja California 1) Departamento de Oceanografía Biológica, Centro de Investigación Científica y Educación Superior de Ensenada. km 107 Carretera Tijuana-Ensenada. Apdo. Postal 2732. 22860 Ensenada, Baja California, México. E-mail: berlav@cicese.mx 2) Integrative Oceanography Division, Scripps Institution of Oceanography, UCSD. La Jolla California 92093-0218, USA. Bertha E. Lavaniegos1,2 Luis C. Jiménez-Pérez1Julio C. Hernández-León1 Quarterly cruises off Baja California has been done since September 1997, through the IMECOCAL program (Investigaciones Mexicanas de la Corriente de California). The station grid (Fig. 1) and methods is based on the CalCOFI original plan. The routine includes CTD casts and oblique zooplankton tows with bongo net of 500 µm mesh-width. This permit us to use the 1950-1978 seasonal means of oceanographic properties (Lynn et al. 1982) to estimate anomalies (Fig. 2). During 2003 opposite trends in temperature and salinity were observed and are still not well explained, but could be due to the invasion of subartic waters masked with a weak El Niño (Fig. 2). The subarctic water invasion has been documented for other sectors of the California Current (Venrick et al. 2003). A trend of lower biomass during the last six years was evident only for the north region, compared to the period 1951-1984; particularly during La Niña 1998-1999 and the first half of 2002 (Fig. 3). In contrast, the central region showed typical values apart of El Niño 1997-1998. Total abundance showed a similar pattern (Fig. 4) of higher values in the central region, reaching up to three times the average of the north region in some cruises. Note the high abundance observed in winter 1998 in both regions compared to other winter cruises. The community structure also recorded interannual and regional changes. Chaetognaths were found in higher percentage during El Niño 1997-1998, particularly in the north region (Fig. 5). This could explain, in part, the low proportion of copepods. The central region had high proportion of tunicates, mainly salps, during El Niño 1997-1998 and the transition to La Niña 1998-1999. Swarms of these tunicates were scarcely observed in the northern region through the entire study period, apart from two cruises (9901 and 0207). Two strong interannual events (El Niño and La Niña) were recorded during 1997-1999. After these events the system has maintained relatively low temperatures through the end of 2002, particularly near the coast at Line 120. Positive anomalies of temperature and salinity in the upper waters indicates a higher influence of southwest waters, while anomalies from zero to negative correspond with a higher influence of the California Current core (Fig. 2). Figure 3. Zooplankton biomass (mean ± 95% conf. int.) during 1997-2003 in the northern and central Baja California waters. Dashed line is the historical mean for the period 1951-1984 based in CalCOFI data. (Data were log-transformed). Punta Baja (30°N) has been considered the boundary of two oceanographic regions (US GLOBEC, 1994). The area northward to this prominence is part of the Southern California eddy, where longshore wind stress reach a minimum. At south, advection moderately increase and modest but persistent winds promote upwelling year-round. The central region compared to the north region presents a damped seasonality in macrozooplankton biomass (Fig. 3). • ACKNOWLEDGEMENTS • To the R/V Francisco Ulloa crew and the IMECOCAL staff. Grants: CONACYT (G0041-T9607, G3532-GT, 017PÑ-1297), IAI (ISP 2-124), CICESE (6212, 6548), and US GLOBEC (OCE 01-103000). • References: • Lynn RJ, Bliss KA, Eber LE (1982) Vertical and horizontal distributions of seasonal mean temperature, salinity, sigma-t, stability, dynamic height, oxygen and oxygen saturation in the California Current, 1950-1978. Calif. Coop. Ocean. Fish. Invest. Atlas 30:1-513. • U.S. GLOBEC (1994) A science plan for the California Current. U.S. Globec Ocean Ecosystem Dynamics Univ. Calif., Berkeley 11:1-134. • Venrick E, Bograd SJ, Checkley D, Durazo R, Gaxiola-Castro, G, Hunter J, Huyer A, Hyrenbach KD, Lavaniegos BE, Mantyla AW, Schwing FB, Smith RL, Sydeman WJ, Wheeler PA. 2003. The state of the California Current, 2002-2003: Tropical and subarctic influences vie for dominance. Calif. Coope. Ocean. Fish. Invest. Rep 44:28-60.