Spatial data models (types)
220 likes | 868 Views
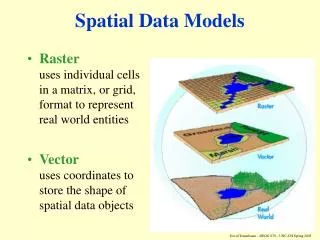
Spatial data models (types). Lecture 3, 9/7/2006. Two basic data models to represent these features. Raster spatial data model Define space as an array of equally sized cells arranged in rows and columns. Each cell contains an attribute value and location coordinates

Spatial data models (types)
E N D
Presentation Transcript
Spatial data models (types) Lecture 3, 9/7/2006
Two basic data models to represent these features • Raster spatial data model • Define space as an array of equally sized cells arranged in rows and columns. Each cell contains an attribute value and location coordinates • Individual cells as building blocks for creating images of point, line, area, network and surface • Continuous raster • Numeric values range smoothly from one location to another, for example, DEM, temperature, remote sensing images, etc. • Discrete raster • Relative few possible values to repeat themselves in adjacent cells, for example, land use, soil types, etc. • Vector spatial data model • Use x-, y- coordinates to represent point, line, area, network, surface • Point as a single coordinate pair, line and polygon as ordered lists of vertices, while attributes are associated with each features • Usually are discrete features
RASTER • VECTOR • Real World DIGITAL SPATIAL DATA Source: Defense Mapping School National Imagery and Mapping Agency
Raster and Vector Data Models Real World 600 1 2 3 4 5 6 7 8 9 10 G 1 B Trees 500 2 G B G 3 B 400 G G 4 B Trees Y-AXIS 5 B G G 300 B BK 6 G G House 7 B 200 B B 8 River 100 9 B 200 500 100 300 600 400 10 B X-AXIS Raster Representation Vector Representation Source: Defense Mapping School National Imagery and Mapping Agency
Example: continuous raster Xie et al. 2005
Raster Real world Vector Heywood et al. 2006
Effects of changing resolution Heywood et al. 2006
Vector – Advantages and Disadvantages • Advantages • Good representation of reality • Compact data structure • Topology can be described in a network • Accurate graphics • Disadvantages • Complex data structures • Simulation may be difficult • Some spatial analysis is difficult or impossible to perform
Raster – Advantages and Disadvantages • Advantages • Simple data structure • Easy overlay • Various kinds of spatial analysis • Uniform size and shape • Cheaper technology • Disadvantages • Large amount of data • Less “pretty” • Projection transformation is difficult • Different scales between layers can be a nightmare • May lose information due to generalization
GIS data formats (files) • Shapefiles • Coverages • TIN (e.g. elevation can be stored as TIN) • Triangulated Irregular Network • Grid (e.g. elevation can be stored as Grid) • Image (e.g. elevation can be stored as image) Vector data Raster data
Shape Files • Nontopological • Advantages no overhead to process topology • Disadvantages polygons are double digitized, no topologic data checking • At least 3 files .shp .shx .dbf
Coverages • Original ArcInfo Format • Directory With Several Files • Database Files are stored in the Info Directory • Uses Arc Node Topology • Containment (coincident) • Connectivity • Adjacency
©Arthur J. Lembo Cornell University TIN • A triangulated irregular network (TIN) is a data model that is used to represent three dimensional objects. In this case, x,y, and z values represent points. Using methods of computational geometry, the points are connected into what is called a triangulation, forming a network of triangles. The lines of the triangles are called edges, and the interior area is called a face, or facet. • While the TIN model is somewhat more complex than the simple point, line, and polygon vector model, or the raster model, it is actually quite useful for representing elevations. For example a raster grid would require grid cells to cover the entire surface of a geographic area. Also, if we wanted to show great detail we would have to have small grid cells. Now, if the land area is relatively flat, we would still need the small grid cells. However, with a TIN we would not have to include so many points on the flat areas, but could add more points on the steep areas where we want to show greater detail. • The illustration shows how we can create a TIN of the terrain around Ithaca, NY. • First, a series of elevation points are created • Second, a TIN face is created with the elevation data • Third, the faces are shaded in to give the impression of a 3D surface
Components of a TIN • Nodes • Edges • Triangles • Hull • Topology ©Arthur J. Lembo Cornell University
Grid Properties • Each Grid Cell holds one value even if it is empty. • A cell can hold an index standing for an attribute. • Cell resolution is given as its size on the ground. • Point and Lines move to the center of the cell. • Minimum line width is one cell. • Rasters are easy to read and write, and easy to draw on the screen.