Download
1 / 21
390 likes | 772 Views
Spatial data Visualization spatial data Ruslan Bobov. Introduction What is Spatial Data? Spatial Data Types Vector Data Raster Data Visualization of Spatial Data . What is Spatial Data?

E N D
Spatial data Visualization spatial data RuslanBobov
Introduction What is Spatial Data? Spatial Data Types Vector Data Raster Data Visualization of Spatial Data
What is Spatial Data? Spatial Data – it is the data or information that identifies the geographic location of features and boundaries on Earth , such as natural or constructed features, oceans , and more . Spatial data is usually stored as coordinate and topology, and is data that can be mapped.
In GIS, there are 2 basic spatial data types Spatial Data Types Raster Vector
Vector Data Vector data provide a way to represent real world features within the GIS environment. A vector feature has its shape represented using geometry. The geometry is made up of one or more interconnected vertices. A vertex describe a position in space using an x, y and optionally z axis. In the vector data model, features on the earth are represented as: points lines / routes polygons / regions TINs (triangulated irregular networks)
Vector Data This system of recording features is based on the interaction between arcs and nodes, represented by points, lines and polygons. A point is a single node, a line is two nodes with an arc between them, and a polygon is a closed group of three or more arcs. With these three elements , it is possible to record most all necessary information. Points Lines Polygons
Vector Data Vector data are good at accurately representing true shape and size representing non-continuous data (e.g., rivers, political boundaries, road lines, mountain peaks) creating aesthetically pleasing maps conserving disk space
Vector Data Advantages : Data can be represented at its original resolution and form without generalization. Graphic output is usually more aesthetically pleasing (traditional cartographic representation); Since most data, e.g. hard copy maps, is in vector form no data conversion is required. Accurate geographic location of data is maintained. Disadvantages: The location of each vertex needs to be stored explicitly. For effective analysis, vector data must be converted into a topological structure. This is often processing intensive and usually requires extensive data cleaning. As well, topology is static, and any updating or editing of the vector data requires re-building of the topology.
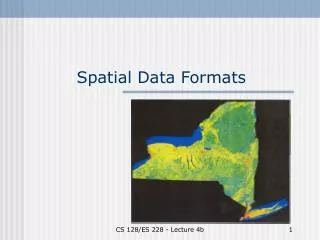
Raster Data Raster Data – cell –based data such as aerial imagery and digital elevation models. Raster data is characterized by pixel values. Basically, a raster file is a giant table, where each pixel is assigned a specific value from 0 to 255. The meaning behind these values is specified by the user – they can represent elevations, temperature, hydrology and etc.
Raster Data Raster data are good at: representing continuous data (e.g., slope, elevation) representing multiple feature types (e.g., points, lines, and polygons) as single feature types (cells) rapid computations ("map algebra") in which raster layers are treated as elements in mathematical expressions analysis of multi-layer or multivariate data (e.g., satellite image processing and analysis) hogging disk space
Raster Data Advantages : The geographic location of each cell is implied by its position in the cell matrix. Accordingly, other than an origin point, e.g. bottom left corner, no geographic coordinates are stored. Due to the nature of the data storage technique data analysis is usually easy to program and quick to perform. The inherent nature of raster maps, e.g. one attribute maps, is ideally suited for mathematical modeling and quantitative analysis. Grid-cell systems are very compatible with raster-based output devices, e.g. electrostatic plotters, graphic terminals.
Raster Data Disadvantages: The cell size determines the resolution at which the data is represented.; It is especially difficult to adequately represent linear features depending on the cell resolution. Accordingly, network linkages are difficult to establish. Processing of associated attribute data may be cumbersome if large amounts of data exists. Raster maps inherently reflect only one attribute or characteristic for an area. Most output maps from grid-cell systems do not conform to high-quality cartographic needs.
Assignment: Creating the vector data with software in computer. Prepare the thematic map (using free vector data source form Internet )