Download
1 / 15
150 likes | 307 Views
Chapter 2.6 Measures of Spread. Jason Patel Pg.136. Deviations difference between an individual value in a set of data and the mean. Population Deviation Sample Deviation Larger the deviation = greater the spread in data (the further the data is from the centre) Values…

E N D
Chapter 2.6 Measures of Spread Jason Patel Pg.136
Deviationsdifference between an individual value in a set of data and the mean • Population DeviationSample Deviation • Larger the deviation = greater the spread in data (the further the data is from the centre) • Values… • Less than mean = negative deviations • Greater than mean = positive deviations • Zero = equal to mean
Standard Deviationthe square root of the mean of the squares of the deviations Pop St DevSample St Dev • , sigma, represents st dev. of pop. • N, number of data in pop. • s, represents st dev of a sample • n, number in sample • *** n-1 compensates for the fact that a sample taken from population tends to underestimate the deviations in the population
Variancemean of the squares of the deviations Population VarianceSample Variance
Standard Deviation Example There are 2 teams and the sport is Tug-Of-War IRON MEN Bench Press (lbs) Deviation, (x- ) HULKS Bench Press(lbs) Jason 140 -58 3364 Damir 182 Vlad 185 -13 169 Aydin 178 Hisham 240 42 1764 Vince 180 Ajay 235 37 1369 Ethan 200 Topic 190 -8 64 Dave 190 Sum 990 0 6370 Contd…
Iron Men Hulks The Iron Men have a stronger mean in bench press than the Hulks, but standard deviation is greater in spread for the Iron Men, so they have some really strong and really weak team mates. Since the Hulks have a much lesser spread, their team mates are more closely matched in strength.
Quartiles and Interquartile Ranges Quartiles – divide a set of ordered data into 4 groups with equal numbers • Interquartile Range- Q3-Q1 range of middle half of data • Larger this range the larger the spread • Semi-Interquartile Range - ½ the Interquartile range • Quartile Formulas • First quartile position: Q1 = (n+1)/4 • Second quartile position: Q2 = (n+1)/2 (the median position) • Third quartile position: Q3 = 3(n+1)/4 • *where n is the number of values • **Q1 and Q3 are ALWAYS whole numbers, so make sure to round up or down
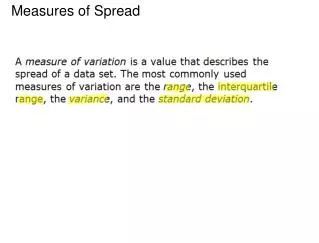
Box and Whisker Plotillustrates measures No outliers Outliers Outlier – any point 1.5 times the box length away from the box
Box & Whisker Plot Example At a Formula 1 race, a survey with spectators was taken and were asked how many times they had attended a F1 race. Below is the data gathered: 27 28 3 7 8 4 20 2 9 60 33 24 4 1 25 20 21 17 13 24 • Determine the median, Q1, Q3 and Interquartile & Semi-Interquartile Ranges • Make a box & whisker plot • Compare results to last years survey which a median of 22.7 & Interquartile range of 14 was found. 1 3 4 4 7 8 9 12 13 17 20 20 21 24 24 25 27 28 33 60 a) Median= Q1= Q3= Interquartile Range= 25-7=18 Semi-Interquartile Range= ½ the people surveyed have attended between 7 – 25 races. Contd…
Since the piece of data, 60, is an outlier, a modified box & whisker plot will be required. • c) More people in 2005 have seen F1 races than last year, but the data seems more spread out.
Classifying Data by Quartiles Research found the winning percentage of the 2004 season of the top 5 Formula One teams. Median was found at 25.6%, Q1= 6.8%, Q3= 48.7%. Describe the following data in terms of quartiles: TeamsWin Record(%) Ferrari 54.6 William/BMW 18.4 Bar Honda 7.2 Jordan 3.4 Mercedes Benz/ West 2.7 • Ferrari’s percentage was above Q3 quartile, so its placed in the fourth- or top quartile. • William/BMW & Bar Honda were both found between Q1 & the median, so they would fall in the second quartile. • Jordan & Mercedes Benz/West came below Q1, so they would fall in the first quartile.
Percentilessimilar to quartiles but divide the data into 100 intervals that have equal numbers and values At a race track 25 cars were tested for top speed, ¼ mile time, handling & braking distance, the raw scores that the judges had given are as follows: 42 57 62 74 78 81 88 92 97 47 58 67 75 79 84 91 94 49 60 73 76 80 86 91 96 • If the Honda SiR scored at the 40th percentile, what was its raw score? - Find 40% of 25 numbers, which is 8. Choose the 8th number down the list, therefore the Honda’s raw score is 67. • What is the 90th percentile for these data? - Since 90% of 25 is 22.5, find the midpoint between the 22nd & 23rd numbers which are 92 & 94. Therefore, the midpoint is 93. • Will Subaru’s WRX STi score of 88 place it at the 88th percentile? - Take 88% of the 25 scores which is 22. Find the midpoint between raw scores 22 & 23 which is 93. Therefore the Subaru is below the 88th percentile.
Z-Scoresnumber of standard deviations that a datum is from the mean PopulationSample ***Values with… Negative Z-score below mean Positive Z-score above mean Zero Z-score equal to mean
Z-Score Example Determine the z-scores for the Honda SiR and Subaru WRX STi cars. Using excel I have determined that the mean is 73.88 & the standard deviation to be 18.92. Using the mean and standard deviation, calculate the z-scores for the 2 vehicles. Honda SiRSubaru WRX STi Therefore, the Honda SiR is 36% of a standard deviation below the mean, while the Subaru WRX STi is 75% of a standard deviation above the mean.
And that concludes the presentation, which leaves only one thing left to say. PEACE OUT!