Download
1 / 46
500 likes | 599 Views
Characterizing Soil Horizons. Physical Properties of Soils. Idealized Surface Soil. Voids. Solids. Avenues Storage Distribution Movement . Interactive Media Minerals Organic matter Reactivity. Bedrock. Parent Material to Soil. Differentiation. Parent Material. Additions. Losses.

E N D
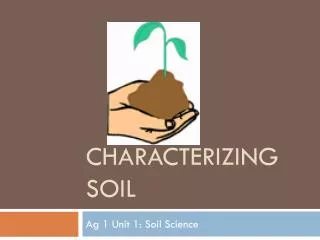
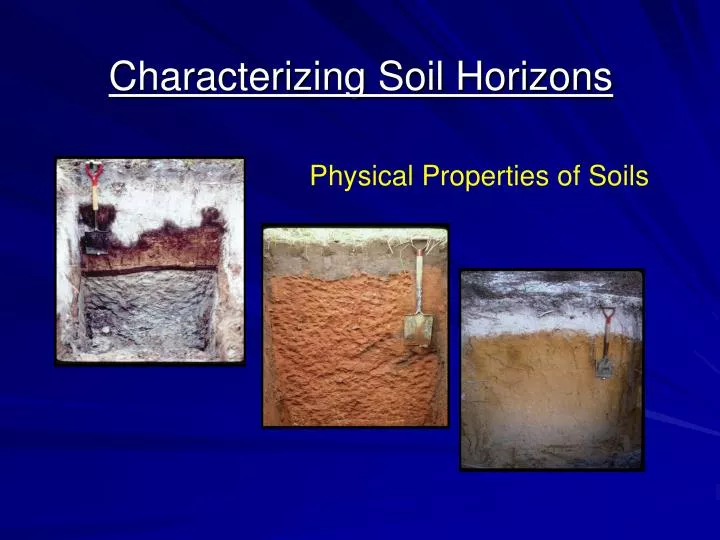
Characterizing Soil Horizons Physical Properties of Soils
Idealized Surface Soil Voids Solids Avenues Storage Distribution Movement Interactive Media Minerals Organic matter Reactivity
Bedrock Parent Material to Soil Differentiation Parent Material Additions Losses Translocations Transformations Bedrock
Soil Horizons Roughly parallel layers in the soil with varying composition and properties
Criteria for Characterizing Soil Horizons • Color • Texture • Density • Structure • Organic matter • Mineralogy • Chemistry
Soil Color Hue dominant spectral color; related to the wavelength of light. Related to the proportions of red to yellow. Value related to total amount of light reflected. Chroma measure of the strength of spectral color
Hue = 10 YR Value = 6 Chroma = 3 Munsell Color 10 YR 6/3
Physical Criteria for Delineating Horizons • Color • Texture • Structure • Density
The Soil Mineral Component: Texture the size of soil particles
Soil texture refers to the relative amounts of three distinct size separates comprising the soil mineral component. Sizes classes of particles Sand Silt Clay
Soil Texture Quartz Distribution 100% clay silt sand Diameter Class Dominant Minerals Sand (2.0 – 0.05 mm) Quartz Silt (0.05 – 0.002 mm) Quartz /Feldspars/mica Clay (<0.002 mm) Secondary minerals
Importance of Soil Texture (Distribution of particle sizes) Soil Porosity Particle Surface Area Water/Gas Movement Reactivity
Soil Porosity Porosity – the total volume of soil pores - the distribution of pore sizes Clay Silt Sand
Texture, Pore Sizes, and Water Large particles yield large pore spaces Small particles yield small pore spaces Water moves rapidly and is poorly retained in Coarse-textured sandy soils. Water moves slowly and is strongly retained in Fine-textured, clayey soils.
Rapid Sands Poor Retention Clays/iron Slow Water Retained
1 mm 1 mm 1 mm 2 mm 2 mm 2 mm Each face is 4 mm2 Each face is 1 mm2 6 faces x 4 mm2 = 24 mm2 6 faces x 1mm2 x 8 cubes = 48 mm2 If each of the resulting cubes was divided similarly, the surface area would increase 16 times more
Surface Area nutrients water Interface with the environment gasses O.M. microorganisms units cm2 g Specific Surface Area = Surface Area mass
Specific Surface Area SeparateSSA (cm2/g) Sand 30 Silt 1500 Clay 3,000,000 16 g of clay
100 g soil Soil A Soil B 90 g sand 5 g silt 5 g clay 95 g sand 4 g silt 1 g clay 90 g sand x 30 g/cm2 = 2700 cm2 95 g sand x 30 g/cm2 = 2850 cm2 5 g silt x 1500 g/cm2 = 7500 cm2 4 g silt x 1500 g/cm2 = 6000 cm2 5 g clay x 3 M g/cm2 = 15 M cm2 1 g clay x 3 M g/cm2 = 3 M cm2 Total = 15,010,200 cm2 Total = 3,008,850 cm2
Soil Horizons Texture Clay Content Surface Area Potential Reactivity
Florida Soils clay Sand <10% Loamy sand 10 – 15% Sandy loam 15 – 20% Sandy clay loam 20 – 35% Sandy clay 35 – 55% Clay > 50%
Texture-by-Feel Relative amounts of 3 soil separates: Sand, Silt, and Clay Gritty smooth plastic
Soil No Ball Sand No Ribbon Loamy Sand Increasing Ribbon Length Low Clay Medium Clay High Clay Grittiness, Smoothness Texture-by-Feel Field Analysis
Texture by Feel Sand = Gritty Silt = Smooth Clay = Sticky, Plastic
Laboratory Analysis Sedimentation – Sand, Silt, and Clay Fraction drag drag gravity
silt sand Sedimentation Sand Silt Clay Sand Silt Clay
Stokes’ Law K g (dp-dL) D2 18ų VelocityV(cm/s) = g = gravity dp= density of the particle dL= density of the liquid ų = viscosity of the liquid V = D2 K = 11,241 cm-1 sec-1 1 cm · sec
0.1 cm 1 cm · sec X cm2 Stokes’ Law V =K D2 K = 11,241 cm-1 sec-1 Sand: D = 1 mm V = 11,241 x (0.1)2 = 112.4 cm/sec
0.0002 cm 1 cm · sec X cm2 Stokes’ Law V =K D2 K = 11,241 cm-1 sec-1 clay: D = 0.002 mm V = 11,241 x (0.0002)2 = 0.00045 cm/sec
sand silt clay
Sedimentation silt 4 hr. 1 min. sand The density of a soil suspension decreases as particles settle out. 1 minute Sand settles out 4 hours Silt settles out suspension
Hydrometer Method Stem Scale Bulb weight 0 g/L hydrometer t = 0 t = 1 min Pure distilled water (18o C) = 0 g/L
Hydrometer Method Sand (%) = 30 g sand = 0.75 = 75% 40 g soil Add 40 g soil to 1liter of water Time = 0 sec density = 40 g/L Time = 1 min. density = 10 g/L Sand settled = 40 g– 10 g= 30 g
Hydrometer Method Clay % = 4 g clay = 0.10 = 10% 40 g soil Time = 4 hrs density = 4 g/L What is being measured? Clay content = 4 g Silt % = 100% - (75% + 10%) 100% - 85% = 15 %
Hydrometer Method Sand = 75% Silt = 15% Clay = 10% Sandy Loam