Download
1 / 27
270 likes | 456 Views
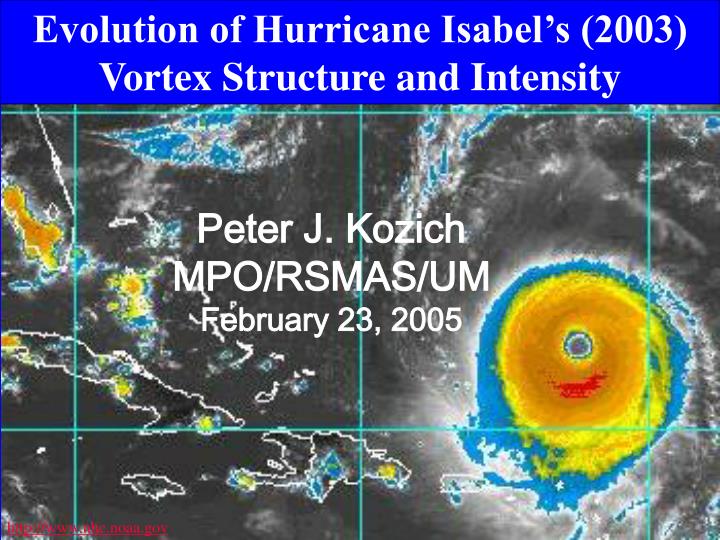
Evolution of Hurricane Isabel’s (2003) Vortex Structure and Intensity. Peter J. Kozich MPO/RSMAS/UM February 23, 2005. http://www.nhc.noaa.gov. MOTIVATION.

E N D
Evolution of Hurricane Isabel’s (2003) Vortex Structure and Intensity Peter J. Kozich MPO/RSMAS/UM February 23, 2005 http://www.nhc.noaa.gov
MOTIVATION Tropical cyclone (TC) dynamic and thermodynamic fields have been well documented by airborne measurements and numerical simulation (e.g., Shea and Gray 1973, Liu et al. 1997, Marks 2003). However, understanding and predicting evolution of TC structure and intensity remains a challenge.
NOAA-42 Reflectivity Analysis Time #1 9/12 1644-1709 UTC 9/12 2000-2030 UTC 9/13 1625-1650 UTC http://www.aoml.noaa.gov/hrd/Storm_pages/isabel2003/radar.html Analysis Time #2 9/13 1915-1945 UTC 9/14 1822-1852 UTC 9/14 2157-2222 UTC
Objectives: By use of airborne radar and model data, we will aim to understand the physical processes in the inner core their effect on intensity change of Isabel (2003). Specifically: • Document the strom structures using airborne. Doppler radar and flight-level data from NOAA P3s. • Compare with high-resolution model simulation to validate/evaluate model results. • Diagnose model results to understand the dynamic processes (e.g., PV, angular momentum, etc.) controlling the evolution of Hurricane Isabel.
Model 5th generation high resolution, non- hydrostatic PSU/NCAR mesoscale model (MM5) Multi-nested, vortex-following domains with grid resolutions of 45, 15, 5, 1.67 km 28 vertical sigma-levels, 9 in boundary layer Initial, lateral BC: NCEP-FNL Analysis, 1° x 1° Lower boundary: SSM/I SST 0.25 ° x 0.25°
MM5 Domains: D04 D02 D03
Data Doppler radar data from horizontally scanning and vertically scanning tail radar on NOAA-HRD WP-3D 42 aircraft Data covers period from 1644 UTC September 12th – 1903 UTC September 14th Following the data analysis procedure described in Marks et al. (1992).
NOAA-42 Reflectivity Analysis Time #1 9/12 1644-1709 UTC 9/12 2000-2030 UTC 9/13 1625-1650 UTC http://www.aoml.noaa.gov/hrd/Storm_pages/isabel2003/radar.html Analysis Time #2 9/13 1915-1945 UTC 9/14 1822-1852 UTC 9/14 2157-2222 UTC
Winds at 2 km level radar MM5
Radius-height mean profiles of radar reflectivity (dBZ): radar MM5
Total Wind Speed (ms-1): radar MM5
Radial Wind Speed (ms-1): radar MM5
Hovmoller Diagrams: http://orca.rsmas.miami.edu/~joe/isabel/hov/
Relative Vorticity, (x 10-3 s-1) at 2 km : x 10-3 s-1 radar MM5
Conclusions • Isabel went through a distinct structural change from the 12th to the 14th as the storm weakened slightly. • The primary convective ring (eyewall) dominates on the 12th, whereas both primary and secondary rings present on the 14th that are weaker, shallower, and larger than that on the 12th. • The radial flow in the low-levels outside of RMW is better defined on 14th. • The horizontal distribution of vorticity appears to be more annular on the 14th. • Model simulated a similar structure of the storm, expect the inner core is larger than the observations.Model results indicate that Isabel went through an eyewall replacement.
Future Work • Continue the airborne Doppler radar and flight-level data analysis and add orthogonal flight legs on 12th and 14th, pair on the 13th. • To work with Dr. Chen and John Cangialosi on improving the MM5 initial condition for Hurricane Isabel. • Analyzing model simulated storm evolution and develop a concept model to understand the dynamic processes in the evolution of Hurricane Isabel (e.g., PV, heat and momentum profiles, and gradient wind profiles, etc.)
Acknowledgments: Many thanks to Shuyi Chen, Dave Nolan, Frank Marks, Peter Dodge, Melicie Desflots, and John Cangialosi for their guidance, suggestions, and dedication.
Procedure: ufd.* HRD radar tapes wind_interpolate XLTRS SUMFILEs wind3_fill swp.* solo Filename.w radar_slicer XLTRS plots
Flight Level Wind Profiles for Plotted Times: 9/12/03: 9/14/03: 1717-1731 UTC (pink) 1625-1642 UTC (blue) 1644-1700 UTC (pink) 1720-1735 UTC (blue)