Download
1 / 71
720 likes | 922 Views
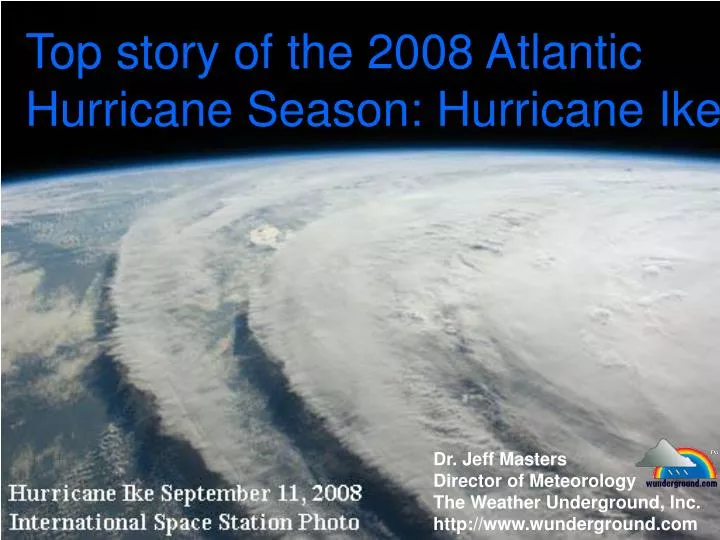
Top story of the 2008 Atlantic Hurricane Season: Hurricane Ike. Dr. Jeff Masters Director of Meteorology The Weather Underground, Inc. http://www.wunderground.com. Ike’s non-U.S. impacts.

E N D
Top story of the 2008 Atlantic Hurricane Season: Hurricane Ike Dr. Jeff Masters Director of Meteorology The Weather Underground, Inc. http://www.wunderground.com
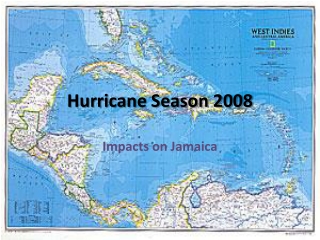
Ike’s non-U.S. impacts • Cuba suffered $3-$4 billion in damage, and 2.6 million people were forced to evacuate (23% of the population) • The Southeast Bahamas had $50-$200 million in damage. Additional heavy damage occurred on the nearby Turks and Caicos Islands. • Haiti suffered the most from Ike, with 74 deaths and ruinous flooding.
Ike’s Integrated Kinetic Energy (IKE) was higher than Katrina when it was at Category 5 strength
Costliest U.S. Hurricanes of all time *Ike did an additional $4.4 billion in damage as an extratropical storm
Largest U.S. Power Outages from a Weather Disaster
Ike’s Death Toll: 30th deadliest U.S. Hurricane • 20 direct U.S. deaths • 34 missing from Galveston and Bolivar Peninsula • 64 indirect deaths in Texas • 28 deaths in TN, OH, IN, IL, MO, KY, MI, PA • 146 total dead and missing in the U.S.
What good came of Ike? • Exposed inadequacies of the Saffir-Simpson Scale, prompting NHC to propose issuing special Storm Surge Warnings • Portlight.org disaster relief charity born
Ike helped launched the Portlight.org disaster relief charity
A Preview of the 2009 Atlantic Hurricane Season Dr. Jeff Masters Director of Meteorology The Weather Underground, Inc. http://www.wunderground.com
Seasonal Predictions, December 2008: Dr. Bill Gray: 14 named storms, 7 hurricanes, 3 intense hurricanes TSR, Inc: 15 named storms, 8 hurricanes, 3.5 intense hurricanes Climatology: 10 named storms, 6 hurricanes, 2 intense hurricanes Since 1995: 15 named storms, 8 hurricanes, 4 intense hurricanes
Since 1995—number of named storms, hurricanes, and intense hurricanes 4 El Nino years 1997 8,3,1 2002 12,4,2 2004 15,9,6 2006 10,5,2 5 La Nina years 1995 19,11,5 1998 14,10,3 1999 12,8,5 2000 15,8,3 2007 15,6,2 5 Neutral years 1996 13,9,6 2001 15,9,4 2003 16,7,3 2005 28,15,7 2008 16,8,5
The wunderground.com March 2009 Atlantic hurricane season forecast: • 14 named storms • 7 hurricanes • 3 intense hurricanes May the steering currents be your friend!
The National Climatic Data Center’s Climate Extremes Index: Percentage of U.S. with max temperatures much below normal and much above normal. Percentage of U.S. with min temperatures much below normal and much above normal. Percentage of U.S. in severe drought and with severe moisture surplus. Percentage of U.S. with a much greater than normal proportion of precipitation derived from extreme (equivalent to the highest tenth percentile) 1-day precipitation events. Percentage U.S. with a much greater than normal number of days with precipitation and without precipitation. http://www.ncdc.noaa.gov/oa/climate/research/cei/cei.html
Is the weather getting more extreme? • Yes. NOAA (Gleason et al., 2008) concluded that the percentage of the U.S. seeing extreme temperatures and precipitation has generally been increasing since the early 1970s. • These increases were most pronounced in summer. • No trends were noted in winter. • 5 of the 15 most extreme years in the past century occurred since 1997.
Expect a 5% increase in hurricane winds per °C of ocean warming (Emanuel, 2005). • Expected increase in SST by 2100: 1-2 °C. • Hurricane wind speeds should increase by 5-10%. • Difference in wind speed between a Cat 3 and Cat 4: 15%. • Thus, major hurricanes in 2100 should do 1.5 - 3 times more damage than they do now.
…Which would lead to increased storm surge damage. • 1910-1920: NJ coast was exposed to high water levels from extreme storms less than 200 hours per year. • Early 1990's: Coast was exposed to high water from storms of the same magnitude 700 to 1200 hours per year. • No increases in storm intensity or frequency that • might account for the increasing high water levels. • Conclusion: Increase in storm surge exposure of the coast was due to sea-level rise of 1 foot over the 80-year period (Zhang et al.,1997)