Download
1 / 19
200 likes | 346 Views
Where does the city start? Urban sprawl and compacity. Jaume Fons-Esteve (Universitat Autònoma de Barcelona). Evidence on European Land Use, 24 May, 2010. What is the unit of analysis?. How to characterise urban sprawl?. Delineation of cities. Administrative. Agglomerations (END - DG ENV)

E N D
Where does the city start? Urban sprawl and compacity Jaume Fons-Esteve (Universitat Autònoma de Barcelona) Evidence on European Land Use, 24 May, 2010
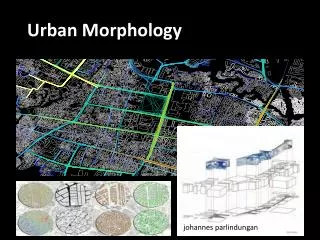
Delineation of cities Administrative Agglomerations (END - DG ENV) Urban Audit (Eurostat) Functional UMZ (EEA) Morphological
Paris City center (UA) CLC 2006
Paris City center (UA) City (UA) Kernel (UA)
Paris City center (UA) City (UA) Kernel (UA) UMZ
Paris City center (UA) City (UA) Kernel (UA) UMZ LUZ (UA)
Data Soil sealing (1) Resolution Urban Audit (1) CLC (3) Extension & Coverage
Implications of different resolution (=) - Urban Audit + CLC
Urban sprawl • Urban form/pattern • Percentage of built-up area • Soil sealing per capita • Compacity index • Mixed uses • Proximity: distance of patches to city centre (normalised accumulated distance) • Dynamics (absolute and comparison centre-peryphery) • Relative increase of built-up area • Land take per capita • Degree of redevelopment • Use of new built-up areas
Differential urban patterns: Madrid Residential areas Commercial and industrial areas
Conclusions • Need to improve our understanding of scale dependency of process (not simple aggregation) • Use the right delineation fit to purpose of analysis • Data: socio-economic data available at grid level • New visualization tools for dynamic process