Download
1 / 79
820 likes | 1.01k Views
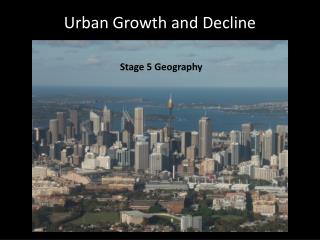
Key topic/chapter 13…Urban Patterns. Key terms:. A nnexation C oncentric zone model D ensity gradient E dge cities F iltering G alactic city G entrification G reenbelts M egalopolis MSA M ultiple nuclei model P eripheral model. P ublic housing R edlining

E N D
Key topic/chapter 13…Urban Patterns Key terms: Annexation Concentric zone model Density gradient Edge cities Filtering Galactic city Gentrification Greenbelts Megalopolis MSA Multiple nuclei model Peripheral model Public housing Redlining Renovated housing Scattered siteSquatter settlement Sector model Smart growth Sprawl Underclass Urban renewal Zone in transition Zoning
Chapter 13…Urban Areas. How are Cities planned? Why are cities where they are? How are they organized? Why are some areas of a city different from other areas of the same city? What is the future of cities?
Settlement • Settlement - permanent collections of buildings, where people live, work, and obtain services
ORIGINS OF SETTLEMENTS • Religious - graves, churches, temples • Cultural - schools, libraries • Political/Military - leader’s house, walls • Economic - stores, food
TYPES OF SETTLEMENTS • Rural Settlements - agriculture as the predominant occupation. • Urban settlements - principal industries are secondary and tertiary.
RURAL SETTLEMENTS Clustered rural settlements–grouped settlements in rural areas to minimize travel RURAL SETTLEMENTS Dispersed rural Settlements - isolated farms with enclosed continuous fields (Found only in N. America and Britain).
Urban Geographers want to know the global distribution of urban settlements. MDC’s have a high percentage of people living in urban areas because of the shift from agriculture-manufacturing-services. Geographers are also interested in where people and activities are distributed within urban spaces. What are the differences between the inner-city and suburban areas and why? As we saw in the last chapter, many downtowns are unique and can often be recognized in photos where the suburbs often look very much alike (Placelessness). Why? Suburbs offer the chance to avoid some of the city problems (crime, tight living area, expensive land/rent, noise, age of buildings) while still keeping a connection with the goods and services of the city: jobs, sports teams, culture, shops, recreation, etc.
Today’s cities are evolving and changing. Although different internal situations characterize urban areas in the US and elsewhere, the problems arising from current spatial trends are quite similar in all cities. Where have urban areas grown: in the early 1800’s only 3% of the earth’s people lived in cities and only Beijing China had more than 1 million people. Today over ½ of the world’s people live in cities and we have over 400 cities of at least 1 million people. Urbanization: is the process by which city population grows. Cities population growth is measured in 2 dimensions; An increase in the number of people living in the cities. An increase in the percentage of people living in the cities. This distinction is important because they happen for different reason and have different global distributions.
Increasing Percentage of People in Cities:a large percentage of people living in urban areas is a measure of a country’s level of development. In MDC’s about ¾ of the people live in urban areas compared to about 2/5 of people in LDC’s. (Except in Latin America where the level is closer to MDC’s.) The higher percentage of people in urban areas comes from the changes that have occurred in the last 200 years as we went from agriculture (primary jobs) to industrial (secondary jobs) and now service jobs, all created by the Industrial Revolution of the 1800’s. People moved to the cities for industrial jobs, but in MDC’s this process has largely ended because nearly everyone interested in moving to the cities from farms has already done so. In LDC’s the percentage of people living in urban areas is growing as people are pushed off of their farms and replaced by machines and as people move to cities looking/hoping for industrial jobs.
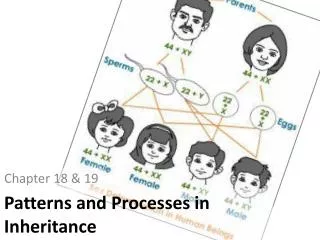
Increasing Number of People in Cities: MDC’s have a higher percentage of people living in urban settlements but LDC’s have more of the very large urban settlements (Primate cities). (Rank-size rule, primate cities, chapter 12.) This is interesting because typically the large cities are created from the improvements brought by the Industrial Revolution. This is not the case with the large LDC cities. Migration to the primate city in LDC’s is happening even though job opportunities may not be available. Increasing the population growth in LDC cities is the fact that medical services are better in these cities, thus the child mortality rate is lower. Defining Urban Settlements: defining where urban areas end and rural areas begin is not easy. Geographers have formulated definitions that distinguish between urban and rural areas in two ways: Social differences and Physical differences.
Percent Urban Population Percentof the population living in urban areas is usually higher in MDCs than in LDCs.
The most populated cities in the world Of the top 20, only Moscow, Tokyo and New York are in MDC’s Shanghai China has 14,608,512 people
Social Differences Between Urban and Rural Settlements: it is fair to say that rural people and urban people follow different ways of life. A city can be defined as having 3 characteristics: 1. Large size. People in rural settlements know most of the other people in the settlement. Not true in big cities. Social relationships are often described as “colder” in urban areas because you only see some people at work instead of growing up with them in the settlement. 2. High Density. Having lots of people in a tiny area creates social consequences. A high density of people living in a small area can only be supported if the people specialize (they can’t all be farmers). People are encouraged to compete for jobs, room, and survival in a tightly limited space. Social groups compete to occupy the same space (ethnic/ race problems). Rural settlements have very little of this problem. 3. Social Heterogeneity. The larger the settlement, the greater the variety of people. Being “unusual” in a large settlement is more likely to be accepted than in a small rural one. But despite the freedom to be different that large urban settlements give you, people living there often feel alone because so many people are different from them. There is a stronger feeling of belonging together in small rural settlements.
These 3 differences do not fully answer the question of where urban settlements begin and rural ones end because in today’s MDC’s most everyone has access to cars, telephones, televisions, and “urban type” jobs which reduce the differences between urban and rural lifestyles. “City folk” and “Country folk” are more alike today than they are different. To help distinguish between urban and rural areas we need to add the physical definition of rural and urban to the equation. Physical Definitions of Urban Settlements: In ancient time, cities had defensive walls for protection which clearly defined the physical boundaries of the city. Today the walls are gone but we can still define the physical boundaries in 3 ways: 1. Legal boundary. These are the official boundaries of a city as recognized by the government of the country or state. These “city limits” have been officially given to the city and are physically marked on official maps. The local government of the city has authority to make laws and protect the people inside the city boundaries.
2. Urbanized area. This is the city plus its suburbs or urbanized area that surrounds the city. About 70 percent of US residents live in urbanized areas with 40% being in the suburbs and 30% inside the city limits. The suburbs may have their own city governments but the huge central city dominates what happens in the entire area. • 3. Metropolitan Statistical Area. Cities have an even bigger influence on people than just those living in their city limits and surrounding urbanized areas. People from far away come to shop, use the services, support the sports teams, read the newspapers and watch the television broadcasts of the city. Thus the city has a “functional area” which is its total zone of influence. The US Bureau of Census has created a method of measuring the functional area of the city. Known as the Metropolitan statistical area (MSA) this area includes: • An urbanized area with a population of at least 50,000 • The county within which the city is located. • Adjacent counties with a high population density and a large percentage of residents working in the central city’s county.
Metropolitan Area of Philadelphia Pennsylvania City of Philadelphia Urbanized area (suburbs) Metropolitan Statistical Area New Jersey The metropolitan area of Philadelphia is spread over several counties and four states. It is also a diversified trade center, given its position on the Delaware river.
Micropolitan Statistical Areas: Smaller areas with between 10,000 and 50,000 people, the county where it is found, and adjacent counties tied to the city. This would be a small town and the area dominated by it. Overlapping Metropolitan Areas: Some adjacent MSA’s overlap. A county between two central cities may send a large number of commuters to jobs in both cities. In some areas the cities are so close that they form one continuous urban complex. This is known as a Megalopolis (great city). In a megalopolis, the downtown CBD often has its own distinctive look and the urban areas are visually separated by parks, open spaces, and dairy/truck farms. But at the periphery of the urban areas, the boundaries overlap.
Colorado Springs, population 431,000 Ocala, Florida, population 56,000 Florala, Alabama, population 1,900
Megalopolis, from northern Va. To Maine. This Illustrates the difference between strict city proper definitions and broader urban agglomerations. To define urbanized areas, the U.S. Census Bureau uses the term Metropolitan Statistical Area (MSA) or Consolidated MSA (CMSA) if two or more of them overlap.
Where are People Distributed within Urban Areas? People are not just distributed at random in urban areas. For the most part they concentrate in particular neighborhoods depending on their social characteristics. Geographers want to see where people with particular characteristics are likely to live and why. Three models which try to explain the growth of a city: The Burgess Model The Hoyt Sector Model The Harris and Ullman multiple Nuclei Model
Burgess Concentric Zone Model • In the concentric zone model, a city grows in a series of rings surrounding the CBD. • Burgess Concentric Zone Model: This is the first used to explain the distributions of different social groups within urban areas. It says that a city grows outward from a central place in a series of concentric rings. The precise size and width of the rings vary from one city to another, but some basic types of rings appear in all cities in the same order(see chart above).
Hoyt Sector Model: In this model the city develops in a series of sectors not rings. Certain areas of the city are more attractive for various activities, originally because of an environmental factor (or even pure chance). As the city grows, activities extend outward in a wedge shape. For example, once a wealthy neighborhood is built the next wealthy neighborhood will extend from the first neighborhood further outward from the center. In this way, the best housing is found in a corridor extending outward from the center to the outer edge (see chart on the next page).
The Hoyt Sector Model In the sector model, a city grows in a series of wedges or corridors extending out from the CBD.
Harris and Ullman’s Multiple Nuclei Model: According to this model, a city is a complex structure that includes more than one center around which activities revolve. Examples of these nodes include a port, parks, stadium, neighborhood business center, university, and airport (see chart). This theory states that some activities are attracted to particular nodes, whereas others try to avoid them. A university node may attract well educated people and bookstores while the port will attract hotels and warehouses. Heavy industry and expensive houses rarely are found together. This model shows the effect of the automobile more than any other model.
The Harris and Ullman Multiple Nuclei model The multiple nuclei model views a city as a collection of individual centers, around which different people and activities cluster.
Applications of the Models: The three models help explain where and in some cases, why people live where they do. None of the models by themselves fully explains why and where different types of people live, but combined they give you as good a look as possible at the “Why” of “Where.” Effective use of the models depends on getting good data on the areas. Most countries take a census every 10 years to help determine useful data about the people and places of the country. In our country we divide the census data into areas known as census tractsof about 5,000 people. Each census tract has the data that summarizes the characteristics of the people living within that tract. This information includes things like the race, income, age, and education of the people living in that tract. Social Area Analysis: The data from the census tracts can all be plotted onto maps to show the characteristics of the people living in that tract. This map is known as a social area analysis.
Using Census tract information…Seattle, Washington Each lined area is a census tract of about 5000 people in Seattle Washington. These maps show average household income for 1990 and 2000…note the changes in income in some areas between 1990 and 2000. Using this information, a business can make decisions about where they want to locate a new store or the future of existing stores. You can find census tract information on many topics such as; age, education level, race, ethnicity, crime rate, and land ownership. All can be very valuable information to people looking to open businesses. Note the areas with incomes over $63,000. Examine the changes between 1990 and 2000.
Oakland, California’s Ethnic neighborhoods The small bordered areas are census tracks of 5000 people.
Use of the Models Outside of North America: The 3 models will also work in other places in the world; however social groups in other countries may not have the same reasons for selecting particular neighborhoods as Americans do. European Cities: As in the US, wealthier people in European cities cluster along a sector extending outward from the CBD, however unlike the US, wealthy and middle class Europeans still live in the inner rings of the neighborhoods near the CBD not out in the suburbs. In the past, poorer people lived in the center of the city. Before electricity, social segregation was vertical: richer people lived on the first or second floor of a building while the poorer people lived in the basement or upper floors. In the Industrial Revolution, housing for the poor was constructed near the factories and away from the rich. Today poorer Europeans are less likely to live in the inner-city. Poor quality housing has been renovated for the rich or turned into office buildings. Poorer Europeans tend to live in the outskirts of the city. Vast suburbs with dozens of high rise apartments house the poor. They face long commutes to reach their jobs in the city.
European cities generally do not have the “suburban sprawl” that US cities have. European cities tend to be more pedestrian friendly with more parks downtown as Europeans tend to still live downtown. US cities have taller buildings as European cities tend to be older and more historic. American cities have more ethnic neighborhoods than European cities. Ethnic neighborhoods that do exist in European cities tend to be in the suburbs. WHY? Because the established richer neighborhoods tend to be downtown in European cities.
Less Developed Countries: Like Europe, most LDC’s accommodate their poor in the suburbs with their middle class and rich living near the center of the city. LDC’s have passed through 3 periods of city building: before the Europeans arrived, during the period of European colonialism, and since independence from European control. Pre-colonial Cities: Before the Europeans arrived few cities existed in Africa, Asia, and Latin America and most people lived in small rural settlements. Those cities that existed were mostly laid out surrounding a religious center; with the rest of the city laid out in a hieratical concentric pattern (like the Burgess model) from government buildings, homes of the wealthy, and businesses related to the religion out to other businesses and shops. Colonial cities: When the Europeans took over these lands, they changed the cities by adding services to help the Europeans control the conquered people. Often a new European style city would be build next to the existing native one. The new European cities contained wider streets, a public square, larger houses and a much lower density. The Spanish used the “Law of the Indies” which was a city plan designed specifically to build cities in a “Spanish” style. (Gridiron pattern for streets centered on a church and central plaza, walls around individual houses and neighborhoods centered around smaller plazas and more churches.)
Early Mexico city was laid out in a grid pattern of streets. This followed the Spanish “Law of the Indies.” Central Plaza in Mexico City 1920 photo. Typical Colonial City plan.
Part of downtown Mexico city today still shows the building plan of the “Law of the Indies.”
Cities since Independence: Following independence, cities have become the focal point of the development of most LDC’s. Millions of people have migrated to the cities (Primate cities) looking for jobs and services. Some capitals have been moved to isolated areas in an attempt to help develop that area of the country (Brasília) This is know as a forward capital. Latin American cities have developed their own unique style. Squatter settlements: The LDC’s are unable to house the rapidly growing number of poor who are flowing into the cities. Because of the housing shortages, the poor have constructed their own settlements around the city. These settlements have few services because neither the city nor the residents can afford them. Squatters have two basic choices for housing. 1. Illegally move into empty real houses located in the city or, 2. Rent slum housing. (85% of the population of Addis Ababa in Ethiopia lives in squatter settlements, slums or other illegal housing.)
Latin American City Model: In many Latin American cities, the wealthy live in the inner city and in a sector extending along a commercial spine. In situ accretion- businesses and homes constantly under construction/repair. Zone of maturity-2nd best housing in the city. Disamenity- unpleasant area used by the poor to get to the market. The poor live in squatter settlements on the periphery of the city.
The City Outline of Rio de Janeiro The rich tourist areas and expensive condo apartments are along the coast and beach while the poor live in squatter shacks in the hills.
City problems: Inner-City Physical Problems: Most US inner cities were constructed before the 1950’s (people began to move to the suburbs in the 1950’s so new construction moved out of the city). Process of Deterioration (how a city deteriorates): A city doesn’t suddenly become old and full of slummy areas. It happens over time. When a group of low-income people inhabit an area of a city, nearby neighborhoods will often look to move out. They sell or rent to more low-income occupants thus expanding the low-income area. Two processes cause/speed up the devaluation of areas: 1. Filtering, 2. Redlining. Filtering: Large houses and buildings that once housed rich downtown workers (who moved to the suburbs) are taken over by landlords who don’t live in that area (they moved to the suburbs too). Rents are low so the landlord doesn’t take as good care of the property as they should and the property becomes run down or abandoned. Stores close, or move, due to lack of sales. 100 years ago these neighborhoods would be used by immigrants and ethnic businesses would succeed in those areas. Now, with a decline in immigration, these neighborhoods have shrunk and so have schools, businesses and other services. Thousands of vacant houses and buildings stand empty in inner cities across America.
Redlining: Some banks refuse to give loans in what they consider risky neighborhoods. They draw a red line on a map around areas where they will not give loans. Without loans, these neighborhoods have a hard time rebuilding/remodeling. Though illegal, this still happens. Bankers just don’t put these “no-loan” areas on a map. Urban Renewal: This is the series of projects to improve European and N. American cities by buying up the blighted neighborhoods, moving the people to new government built housing projects, and building new roads, and other projects to make the inner city attractive for business again. National and State government grants help pay for these projects.
Public housing: Housing for the poor, built with government funding as part of urban renewal. In the US this is only about 2% of the housing while in some countries it may be more (Britain is 30%). Public housing built in the 50’s & 60’s were largely high rise apartments, but those are seen as being unsatisfactory. Problems arise from cramming large numbers of poor people into one area. Today most public housing projects are one to three story buildings with many of them being scattered around different parts of the city rather than clustered into one area. Because urban renewal has been criticized for destroying the social cohesion of older neighborhoods, many governments (like the US) have stopped funding most projects since the 1970’s. What do we do instead? Renovated Housing: An alternative often used since the 70’s is to renovate a building instead of urban renewal. The process where middle-class people move into inner-city neighborhoods and renovate them is called gentrification. Gentrified inner-city neighborhoods also attract middle-class people who work downtown. Living close to work saves the hassle of commuting and rejuvenates run down inner-city neighborhoods
Gentrified building downtown Harlem, NY. Note the supermarket.
Inner-City Social Problems: Inner-city residents are often referred to as the permanent underclass because they are trapped in an unending cycle of economic and social problems. High unemployment, alcoholism, drug addiction, literacy, juvenile delinquency, and crime all exist at a higher rate among those who live in the inner-city. Lack of jobs means lack of tax dollars to pay for police and fire protection as well as good schools. Lack of job skills and homelessness are also tremendous problems. Culture of Poverty: Inner-city residents are trapped in a permanent underclass culture that reproduces itself. In the US, unwed mothers give birth to 2/3 of the babies in the inner-city. 90% of these children live with only one parent and it is real hard for one parent to keep a job and take care of children. Both suffer and a shortage of care and daily attention by the parent contributes to the kids not learning the skills necessary to do well in school which leads to poor jobs for their futures. Poverty leads to more poverty. Many families on welfare have only one parent because it is financially better if one parent is gone, that way the single parent gets food stamps and other services from the government that they would not get if it was a 2 family household.