Download
1 / 23
250 likes | 472 Views
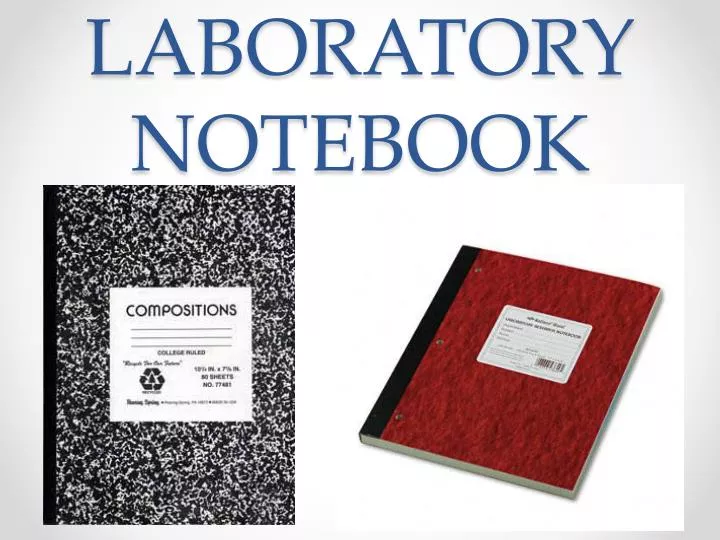
LABORATORY NOTEBOOK. Organization of lab notebook/binder. Keep a table of contents at the beginning of the binder (about 2 pages) For each lab, start with the printed lab handout from teacher

E N D
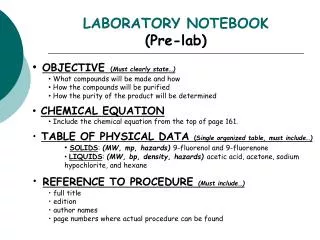
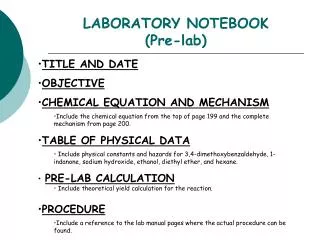
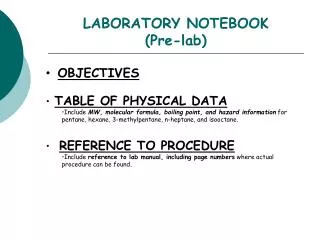
Organization of lab notebook/binder • Keep a table of contents at the beginning of the binder (about 2 pages) • For each lab, start with the printed lab handout from teacher • Followed by the solved pre - lab questions, show all work for credit(correct number of sig. figs) • Then include the laboratory report completed according to the following format:
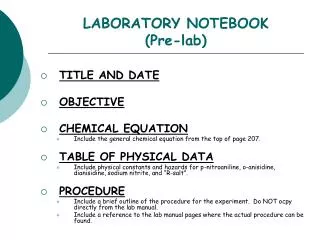
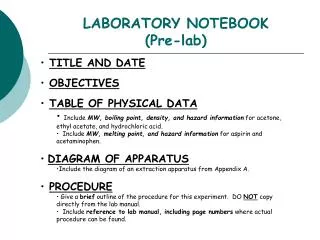
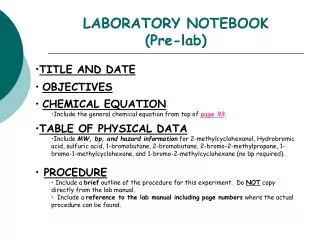
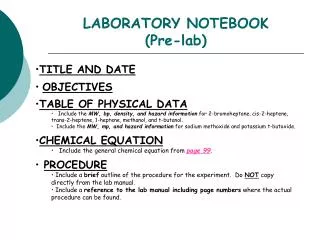
1. Title • Place it on the top of the first page • Write the name(s) of the person(s) doing the experiment • Date of when the experiment was performed Solubility Product of Silver Acetate
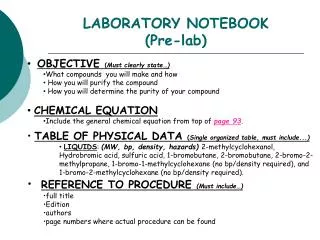
2. Objective/Purpose • What are the main reasons you are performing this experiment? • Be specific...don't just restate the title or copy the generic objectives from the given lab packet. • One or two sentences “In this laboratory experiment, I will use a precipitation titration of a standard potassium chloride solution to determine Ksp for silver acetate in water.”
3. Chemical Reaction • If applicable…. • List the balanced chemical reactions involved in the experiment
4. Equipment • A bulleted list of all the equipment and chemicals you will use in this experiment 1 10 mL pipette 1 25 mL pipette 2 burettes 1 gravity funnel/filter 4 Erlenmeyer flasks Silver acetate
5. SAFETY CONSIDERATIONS • List applicable safety rules to consider in this experiment, special handling and disposal instructions based on MSDS pages.
6. Procedure • In your own words, write a brief summary of the procedure in paragraph format. • Do not include lengthy, detailed directions. • A person who understands chemistry should be able to read this section and know what you are doing.
6. Procedure 2. Clean the 10- and 25-mL pipettes and the burette by soaking with soap and water followed by rinses with tap water and distilled water. Set up the burette in the burette clamp. 3. In order to be certain that the silver acetate solutions are saturated with silver acetate, an excess quantity of solid silver acetate has been added to each solution, which must be removed before the solutions are used in the titrations that follow. 4. Obtain approximately 70 mL of saturated silver acetate (in distilled water) and filter through a gravity funnel/filter paper to remove any cloudiness/solid. Rinse the burette with small portions of the filtered silver acetate solution; then fill the burette and record the initial reading to the nearest 0.02 mL (reading the bottom of the meniscus). 5. Pipette 10 mL of the standard 0.0500 M KCl solution into a clean Erlenmeyer flask. Then add 15 mL of distilled water. 6. Add approximately 1 mL of 5% potassium chromate solution. The color change will follow. 7. Titrate the KCl solution with the silver acetate until the indicator changes color. Record the final volume of silver acetate solution in the burette. 8. Repeat the determination twice for consistent results. .
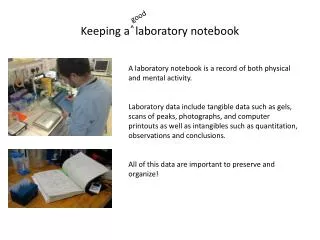
7. Data/Observations/Results • record all the measurements and observations you made during the lab, and attach any graphs and charts generated during or after the lab to display your data • Include units for all measurements. • Do not erase when recording data; simply draw a single line through a mistake and record the new value next to it.
7. Data/Observations/Results • record all the measurements and observations you made during the lab, and attach any graphs and charts generated during or after the lab to display your data • Include units for all measurements. • Do not erase when recording data; simply draw a single line through a mistake and record the new value next to it.
7. Data/Observations/Results A. Determination of Silver Acetate in Distilled Water mL standard KCl taken ____________________
7. Data/Observations/Results A. Determination of Silver Acetate in Distilled Water mL standard KCl taken ____25.0 mL________________
7. Data/Observations/Results A. Determination of Silver Acetate in Distilled Water • mL standard KCl taken ____ 25.0 mL ________________
Steps 1 – 7 + pre – lab. questions • Must be done BEFORE you start a lab • It will be checked prior to the lab • If not done, you are not allowed to do the lab
8. Calculations/Results • Include all pertinent calculations. • Include all units in all calculations, express all answers to the correct number of significant figures • For repetitive problems, provide one sample calculation for each type of calculation. • Percent error should be also calculated
9. Data Analysis • PRESENT data which you collected • Graphs • Tables • DISCUSS how you obtained the data • Explain calculations • DO NOT restate procedure
9. Data Analysis For example, in your “DATA/OBSERVATION/RESULTS” section you recorded the freezing point of unknown sample #1 to be -5˚C. In the “DATA ANALYSIS” section you will further analyze that data: "We used an electronic temperature probe and determined the freezing point of sample #1 to be -5˚Cas noted in Figure 2 by the flat portion of the curve. This shows that the addition of a solute (NaCl) lowered the freezing point by 5˚Cwhen compared to the curve of the pure sample shown in Figure 1."
10. Conclusion • DISCUSS and ANALYZE your data • What do the calculations/observations/graphs reveal? • Why does or doesn’t the experiment work? • What theory was demonstrated in this experiment? • Compare the results with standard values and list the percent error etc…
10. Conclusion "We showed that solutes such as NaCllower freezing points of pure substances because when we added NaCl, the freezing point dropped by 5 degrees Celsius. When we compared this to a literature value, we found out that the actual drop in temperature should have been 4 degrees Celsius. This difference between our value and the actual value represents an error of 20 % which seems too high. This error might have been caused by having impurities in our “pure sample” or NaCl. To find out whether the suggested causes of errors really played a role in our experiment, we should analyze the purity of the “pure sample” and NaCl by chromatography.”