Download
1 / 9
90 likes | 192 Views
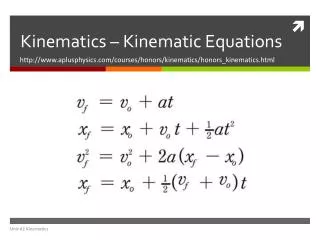
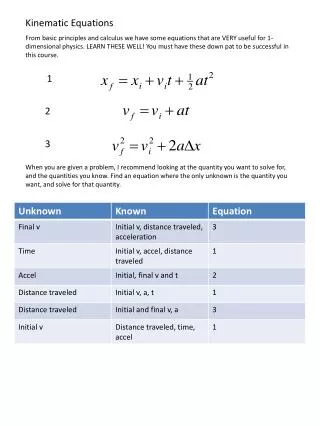
Kinematic Graphs. 3 graphs - same movement. What types of graphs are present in each line? Each row is labeled with a different type of movement. In your own words describe each type of movement (ex. – what is stationary) Why do 3 graphs of the same motion look different?.

E N D
3 graphs - same movement • What types of graphs are present in each line? • Each row is labeled with a different type of movement. In your own words describe each type of movement (ex. – what is stationary) • Why do 3 graphs of the same motion look different?
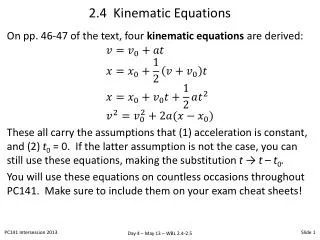
Essential elements of kinematic graphs • Quadrant – the area of the Cartesian plane that the graph is located in. • Point – any point on the graph line • Slope – the amount of slope for each line segment on the graph • Area under the graph – the area betweenthe x-axis and the graph line
The position v. time graph • Quadrant – position relative to the starting point. In QI the object is in the positive direction from the starting point. • Point on the graph – position at that particular instant in time. • Slope – velocity (speed) of the object • Area under the graph – tells nothing of value
2 questions about the position v. time graph • What is the velocity (speed and direction of movement) of the object at 35 s? • Where is the object located at 20 s? Is this in front of or behind the starting position? What about at 40 s?
The velocity v. time graph • Quadrant – the direction of the objects movement (ex. – in QI the object is moving in the + direction) • Point – each point represents the object’s velocity at that instant in time • Slope – the slope represents the magnitude and direction of the object’s acceleration • Area under the graph – represents the object’s position at that instant in time
5 questions about the velocity v. time graph • What is the object’s speed at 2 s? At 4 s? • What is the object’s acceleration from 2 – 3 s? • What is the object’s acceleration from 0 – 2 s? Is it speeding up or slowing down? What is it’s direction? • What is the object’s acceleration from 4 – 5 s? Is it speeding up or slowing down? What is it’s direction? • What is the object’s displacement at 3 s?
The acceleration v. time graph • Quadrant – the direction of the object’s acceleration (ex. In QI the acceleration is positive) • Point – the acceleration of the object at that particular instant in time. • Slope – the change in acceleration over time • Area under the graph – the velocity of the object
3 questions about the acceleration v. time graph • When is the object not accelerating? • What is the acceleration of the object at 15 s? Is it speeding up or slowing down? • What is the object’s speed at 9 s?