Download
1 / 12
120 likes | 211 Views
Diagnosing Thunderstorm Severity using Coupled Proxy GOES-R ABI and Global Lightning Mapper Data. John R. Mecikalski Wayne M. MacKenzie University of Alabama in Huntsville.

E N D
Diagnosing Thunderstorm Severity using Coupled Proxy GOES-R ABI and Global Lightning Mapper Data John R. Mecikalski Wayne M. MacKenzie University of Alabama in Huntsville
Project Goal: To develop a diagnostic algorithm for estimating thunderstorm intensity using geostationary satellite imagery and space-based lightning information. Project Summary: • Proxy GOES-R data will be supplied to this effort from MSG • SEVIRI (8 IR and 1 HRV channel) and TRMM Lightning Imaging Sensor (LIS) Global Total Lightning Flashes product. • Utilize established methods that determine the general vigor and strength of active moist convection will be used. These include: • Convective cloud identification algorithms (for GOES-R and research) • SEVIRI “object tracking” methods • Monitoring satellite temporal trends of the spectral channels. • SEVIRI IR and Visible data “interest field” research physical attributes • TRMM LIS data Diagnosing Thunderstorm Severity using Coupled GOES-R ABI and Global Lightning Mapper Data July 24, 2009
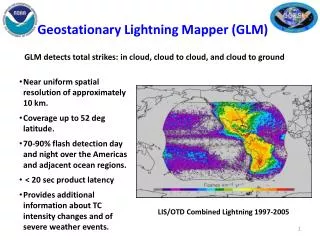
What factors are associated with intense storms? (a)Rapid expansion rates – anvils, convective cores (b) Strong updrafts (c) Overshooting tops* – above the local EL (d) Frequent lightning/High lightning flash rates* (e) Deep cumulonimbus clouds (f) “Enhanced V” signatures* (g) Gravity wave signatures (h) Strong surface outflows (i) Longevity – intense storms last longer (j) Hail (k) Heavy rainfall (>40 dBz) * See Adler et al. (1985); Zipser et al. (2006) *Existing GOES-R Algorithms Diagnosing Thunderstorm Severity using Coupled GOES-R ABI and Global Lightning Mapper Data July 24, 2009
What of these factors can be observed by satellite (GEO and LEO)? (a)Rapid expansion rates – anvils, convective cores (b) Strong updrafts (c) Overshooting tops – above the local EL (d) Frequent lightning/High lighting flash rates (e) Deep cumulonimbus clouds (f) “Enhanced V” signatures (g) Gravity wave signatures (h) Strong surface outflows (i) Longevity – intense storms last longer (j) Hail (k) Heavy rainfall (>40 dBz) Diagnosing Thunderstorm Severity using Coupled GOES-R ABI and Global Lightning Mapper Data July 24, 2009
What of these factors will this study consider towards forming a “Thunderstorm Severity Index”? (a)Rapid expansion rates – anvils, convective cores (b) Strong updrafts (c) Overshooting tops – above the local EL (d) Frequent lightning/High lighting flash rates (e) Deep cumulonimbus clouds (f) “Enhanced V” signatures (g) Gravity wave signatures (h) Strong surface outflows (i) Longevity – intense storms last longer (j) Hail (k) Heavy rainfall (>40 dBz) Diagnosing Thunderstorm Severity using Coupled GOES-R ABI and Global Lightning Mapper Data July 24, 2009
Cloud Properties • Cloud top properties can be broken into three categories to determine intensity: • -Cloud top glaciation indicators • -Updraft Strength • -Cloud Depth • SATellite Convection AnalySis and Tracking (SATCAST) system framework used within the Convective Initiation Algorithm Working Group will be used to identify temporal trends of spectral channels. • SATCAST will in a diagnostic sense, looking backwards in time on cloud properties for identifying “intense storms” Mecikalski et al. (2009)
SATellite Convection AnalySis and Tracking (SATCAST): Convective Cloud Analysis Monitor… 12 IR fields from SEVIRI Once a thunderstorm “object” has been identified, backwards (in time) analysis of the cloud object will be done. Updraft strength, feature expansion, cloud-top altitude and storm longevity will be monitored per object Thunderstorm: Satellite-observed t=Present t=–15 min t=–30 min Diagnosing Thunderstorm Severity using Coupled GOES-R ABI and Global Lightning Mapper Data July 24, 2009
SATellite Convection AnalySis and Tracking (SATCAST): 08 June 2007 MSG Example 1112 UTC 10.8 μm 1112 UTC All Objects 1127 UTC All Objects 1127 UTC 10.8 μm The nowcast captures the growing clouds and omits the mature convection ClNowcast Objects are defined using 10.8 μm BT threshold
Using Lightning as Proxy for Storm Intensity • Many studies have been performed defining intense storms using TRMM (Zipser et al. 2006, Nesbitt et al. 2000, Cecil et al. 2005 and Cecil 2009) and the Lightning Imaging Sensor (LIS) and the TRMM Microwave Imager (TMI) instruments. • Lightning flash rates from LIS have been broken into five categories: • Its important to note that not all convective storms produced lightning and Cecil et al. (2005) suggest that some of those storms may be electrically active but LIS may not be able to reliably detect those flashes. • Goodman et al. (1988) coupled satellite IR data and cloud to ground lightning to develop convective tendencies. Cecil et al. (2005), Nesbitt and Zipser (2003), Nesbitt et al. (2000) Diagnosing Thunderstorm Severity using Coupled GOES-R ABI and Global Lightning Mapper Data July 24, 2009
Research Plan • This research will leverage TRMM products as developed from the precipitation radar (PR), and the Lightning Imaging Sensor (LIS). LIS will be used as a proxy for GLM. • Use of the Meteosat Second Generation (MSG) SEVIRI imager as a proxy for GOES-R ABI. • Using the database from Nesbitt and Zipser (2003) and Liu et al. (2008) of precipitation features from TRMM over Equatorial Africa, and the MSG full disk image....examine coupled TRMM PR, LIS and MSG SEVIRI data. • Develop storm severity based upon the coupled data and using the SATCAST framework for monitoring cloud top spectral trends from MSG SEVIRI. • Using Object Tracking approach developed within the CI AWG, monitor object size as related to storm/anvil expansion rates and storm longevity. Diagnosing Thunderstorm Severity using Coupled GOES-R ABI and Global Lightning Mapper Data July 24, 2009
Relevance to GOES-R Program • Important indicators of cloud top properties will be able to be diagnosed on small temporal scales with high spatial resolution. • Monitoring cloud top properties, lightning activity and storm strength is important over areas with little or no radar coverage. • The current Convective Initiation algorithm for GOES-R is a prognostic algorithm for future cloud growth. The information we have and will learn from the CI AWG will be applied to this algorithm in a diagnostic sense. • This new algorithm would continue to monitor storms after development in a diagnostic sense, monitoring clouds past the current GOES-R AWG CI algorithm timeframe. Diagnosing Thunderstorm Severity using Coupled GOES-R ABI and Global Lightning Mapper Data July 24, 2009
Budget Estimate • Requesting $90 K • 0.85 FTE ~$85 K • $5 K for travel to GOES-R meeting, GOES-R User Conference and AMS Satellite Conference for two people. • More details upon request Diagnosing Thunderstorm Severity using Coupled GOES-R ABI and Global Lightning Mapper Data July 24, 2009