Download
1 / 32
320 likes | 477 Views
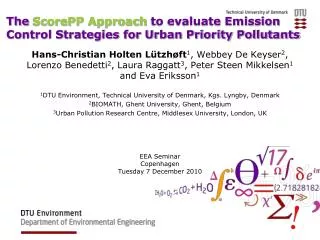
The ScorePP Approach to Predict Releases of Priority Pollutants From Urban Sources. Hans-Christian Holten Lützhøft 1 , Erica Donner 2 , Veerle Gevaert 3 , Webbey De Keyser 3 , Tonie Wickman 4 , Matej Cerk 5 , Eva Eriksson 1 , André Lecloux 6 , Primo ž Banovec 5 and Anna Ledin 1

E N D
The ScorePP Approach to Predict Releases of Priority Pollutants From Urban Sources Hans-Christian Holten Lützhøft1, Erica Donner2, Veerle Gevaert3, Webbey De Keyser3, Tonie Wickman4, Matej Cerk5, Eva Eriksson1, André Lecloux6, Primož Banovec5 and Anna Ledin1 1DTU Environment, Technical University of Denmark, Kgs. Lyngby, Denmark 2Urban Pollution Research Centre, Middlesex University, London, UK 3BIOMATH, Ghent University, Gent, Belgium 4Environmental Monitoring, Stockholm Stad, Stockholm, Sweden 5Faculty of civil and Geodetic Engineering, University of Ljubljana, Ljubljana, Slovenia6Envicat Consulting, Avenue Montesquieu 36, B-1300 Wavre, Belgium EEA SeminarCopenhagenMonday 6 December 2010
Presentation • MSc in pharmacy (1991-1996) • Medicinal chemistry, organic synthesis of AMPA-receptor ligands • PhD (1996-2000) • Environmental Risk Assessment of Antimicrobials; experimental work on ecotoxicity and environmental fate; literature study of ecotoxicity and occurrence in relation to fish farming activities • PostDoc at KU-Life (2000-2001) • Environmental fate of antimicrobials in soil and porewater • PostDoc at Novo Nordisk (2001-2003) • Stability testing of tablets – development of super enhanced stability testing methods • AssProf at KU-Life (2003-2005) • Intestinal absorption of pharmaceuticals • Pharmacist (2005-2006) • AssocProf at DTU Environment (2006- ) • Source characterisation of (organic) priority substances; inherent properties, source tracking, source dynamics, urban releases • Sampling, extraction, purification and analysis or organic substances • Monitoring; Stakeholder interaction
Background • European Water Framework Directive (EU WFD) implemented in 2000 with Environmental Quality Standards implemented in 2008 • Aim of EU WFD is to improve water quality of European water courses • Both pollution source inventories as well as monitoring programmes have to be established • EU member states are obliged to improve water quality through more than one measure, for instance • Legislation • Improved handling and treatment of waste streams (municipal/industrial wastewater or stormwater) • Voluntary initiatives • The EU 6th framework programme financed the DTU Environment coordinated ScorePP (Source control options for reducing the emissions of Priority Pollutants) project • 9 partners with 30+ collaborators across Europe and 4 case cities • SEP2006-MAR2010, 3½ years
Aim • The main aim of the ScorePP project was to develop Source Control Options for Reducing Emissions of Priority Pollutantsfrom urban areas • The specific aim of this task was to identify potential sources and to quantify releases of priority pollutants
Approach Develop Source Classification Framework Compile data on sources & releases Classifying using the Emission String concept Establish releases based on the compiled data
Source Classification Framework • Requirements • Content should be structured and organised in a harmonised way • Ensure that the different sources could be distinguished from each other • To be dynamic and valid EU wide • Inspiration • US EPA Source Classification Code (US EPA SCC) • The Technical Guidance Document on Risk assessment (TGD) • Harmonised codes likethe Common Nomenclature (CN), the National Classification of Economic Activities (NACE) and the NOmenclature for Sources Emissions (NOSE) • EINECS, CAS#
National Classification of Economic Activities (NACE) 18 main classes and about 850 subclasses
NOmenclature for Sources of Emissions (NOSE) 14 main classes and about 750 subclasses
ScorePP classification of the Urban Structure – the Urban Structure Descriptor (USD) 22 classes in use
Source Classification Framework – the Emission String concept • CAS #: unique identification of each substance • NOSE: unique identification of emission processes • NACE: unique identification of economic activities related with the source • The ScorePP classifications • Urban Structure Descriptor (USD), comprising e.g. • Construction sites • Facilities; e.g. factories, dentists, slaughter houses (i.e. legal entities) • Households • Rivers • Roads • Waste sites/landfills • Release Profile Descriptor (RPD) • Temporal releases on a daily, weekly and yearly basis • Release Factor (RF) • All data are stored in a database
Compiling data • Online Risk Assessment Reports from EU • Hazardous Substance Data Bank and Household Product Database from US NLM • Handbooks and electronic compilations, e.g. the Merck Index, Rippen, the e-Pesticide Manual, Kirk-Othmer’s Encyclopedia of Chemical Technology • Research articles
Which sources were identified for a particular PP – DEHP • Handling of the pure substance • Undercoating of motor vehicles • Production of electricity • Release from electrical cables – indoor and outdoor • Treatment of waste; land fills • Various manufacturing; sealants, paint, ink, ceramic, plastic, DEHP • Release from floor and wall covering • Various building materials; tubes, profiles, coated metal sheets • Textiles, clothing, footwear, shoes
To which compartment are the substances released to? • Air • Groundwater • Generally to the urban surface • To an impervious urban surface • To a permeable urban surface • Generally to water (wastewater or receiving waters) • Directly to water (receiving waters) • Indirectly to water (wastewater going to WWTP)
Archetype sources • Agriculture • Construction sites and buildings • Facilities • Households • Roads • Waste disposal • Diffuse and other not immediately classifiable sources
Number of ESs within households(ab 85 ESs in total – 18 substances)
Environmental releases due to households • Heating • Anthracene: 0,8-102 mg/kg wood • Benzo(a)pyrene: 2,7 mg/kg coal • Benzo(a)pyrene: 27 µg/kg wood • Smoking • Anthracene: 34 ng/cigaret • Benzene: 10-100 µg/cigaret • Benzo(a)pyrene: 5-1600 ng/cigaret • Clothes and building materials • DEHP:250 kg • DCM: 10-80 µg/m2/h • TCE: 3,6 µg/m2/h • Fertilizers and pest control • Diuron: 7,5-25 mg/application • Cd: from fertilizers • Building materials • Ni: 0,3-0,8 mg/m2 stainless steel/yr • Cd: 0,01-10 kg/yr from Zn-materials • DEHP: 16 tonnes/yr • Clothes • DEHP: 950 kg/yr • Greywater • Hg: 17µg/PE/d • Cd: 5 kg/yr • TCE: 8-100 µg/L • Ni: jewellery, coins, washing etc. • Benzo(a)pyrene: 1,8 µg/PE/d • Painting and car wash • DEHP: 12 kg/yr • Fertilizers • Cd: 500 g/yr • Building materials • DEHP:600 kg/yr • Plus releases of HCB, HCH, PeCB, TBTs, chlorpyrifos, endrin, Pb, trifluralin and NPs
Environmental releases due to vehicular transport on roads • Anthracene • Combustion: 5,2-28 µg/kg fuel burned, depending on vehicle and fuel type • Benzene • Combustion: 4-10 mg/km driven, depending on vehicle type • Benzo(a)pyrene • Combustion: 1-8 µg/km driven, without and with catalyst • Cadmium (from both break linings, tyres, fuel and asphalt) • 7 kg/year is released in Stockholm with 780.000 inhabitants • DEHP (from undercoating) • 200 kg/year is released in Stockholm with 780.000 inhabitants • Mercury • Tyres: 4-240 µg/km depending on vehicle type • Roads: 3-17 µg/km depending on vehicle type • Nickel • Combustion: 21-107 and 3,2-2310 ng/km driven, for gasoline and diesel, respectively • Brake-linings, tyres and asphalt: 91-182 ng/km
Environmental releases due to vehicular transport on roads Release of nickel from Danish highways: 108 kg • Benzene from cars: 154 tonnes • Benzo(a)pyrene: 360 kg • DEHP: 1,41 tonnes • Depending on fuel and vehicle type: • Anthracene: 12-67 kg • Nickel: 4,4-117 kg • Benzene frombusses, lorries etc: 105 tonnes • Cadmium: 49 kg • Mercury: 0,3-12 tonnes • Plus releases of anthracene from wear & tear of tyres and asphalt and release of anthracene, benzene, benzo(a)pyrene due to leakage & spillage Thomas Ruby Bentzen, PhD thesis (2008)
Conclusions • SCF established – based on literature knowledge about sources • About 900 ESs established for the 25 WFD substances • Ranging from 5 ESs for atrazine and 133 ESs for nickel • Overall 16% with concrete knowledge about release quantities • Overall 65% without any quantitative data on release into the technosphere • WFD substances occur in a wide variety of sources and activities in urban settings and are released to all studied compartments • Most sources are related to production activities • Other large categories are households, waste disposal, agriculture, construction and transport • Substances from households are mainly released to air, wastewater and to the urban surface • Substances released to air (both from household and transport) are mainly bi-products from combustion
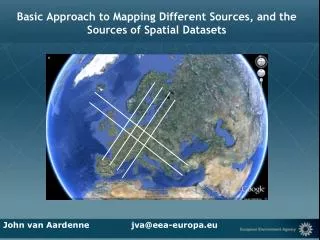
Conclusions – continued • Classifying the sources according to the Urban Structure descriptor enables • Sources to be linked to GIS, thus enhancing visualisation • Definition of archetype sources and thus a better targeting of mitigation options and Emission Control Strategies
Outlook • SCF has been used on national scale to calculate releases from a particular archetype source, i.e. roads (Holten Lützhøft et al., 2009) • SCF has been used to identify pollution sources in catchments of Copenhagen (Holten Lützhøft et al., submitted) • SCF can be used to establish a pollution inventory for a given catchment in the process of either identifying pollution sources or identifying the most appropriate emission control strategy (Eriksson et al., 2010) • Implemented European wide it will help in the process of prioritising finances and work power • It would be interesting to perform a comparison of pollution inventories with human health statistics, i.e. the spatial incidents of cancer compared with for instance the expected releases of benzo[a]pyrene
Acknowledgement • The presented results have been obtained within the framework of the project ScorePP - “Source Control Options for Reducing Emissions of Priority Pollutants”, contract no. 037036, a project coordinated by Department of Environmental Engineering, Technical University of Denmark within the Energy, Environment and Sustainable Development section of the European Community’s Sixth Framework Programme for Research, Technological Development and Demonstration.