Download
1 / 32
320 likes | 454 Views
Emergent Biology Through Integration and Mining Of Microarray Datasets . Lance D. Miller GIS Microarray & Expression Genomics. FOCUS:. Mining of expression data to understand the molecular composition of human cancers and to define components of the tumor molecular profile

E N D
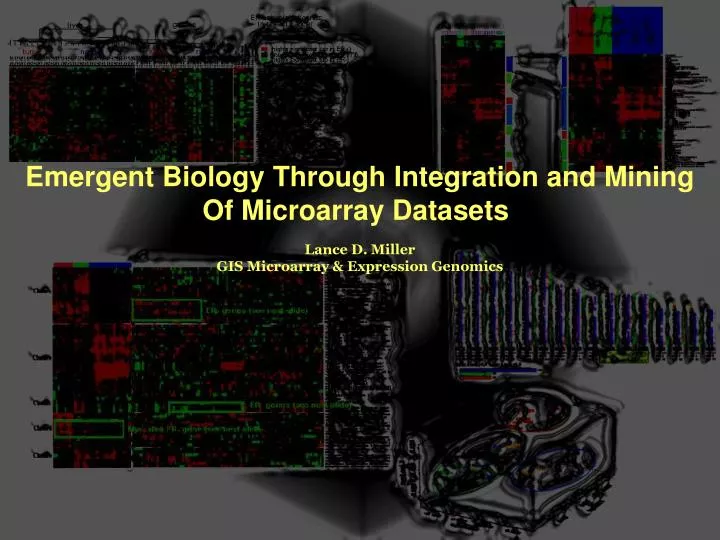
Emergent Biology Through Integration and Mining Of Microarray Datasets Lance D. Miller GIS Microarray & Expression Genomics
FOCUS: Mining of expression data to understand the molecular composition of human cancers and to define components of the tumor molecular profile with mechanistic and clinical importance.
Molecular classes are predictive of outcome overall survival: relapse-free survival:
70-gene prognosis classifier for predicting risk of distant metastasis within 5 years Van’t veer, et. al.
Though each tumor is molecularly unique, there exist common transcriptional cassettes that underly biological and clinical properties of tumors that may be of diagnostic, prognostic and therapeutic significance.
GOAL: Mining of expression data to understand the molecular composition of human cancers and to define components of the tumor molecular profile with mechanistic and clinical importance.
Perou et. al., 1999 Sorlie et. al., 2001 West et. al., 2001 Integration of Independent Datasets
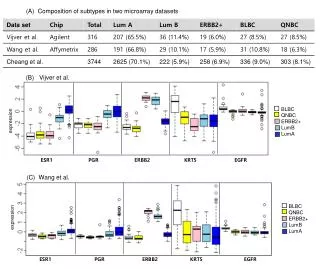
Meta-Analysis of Breast Cancer Datasets: (Adaikalavan Ramasamy et. al.) datasetsourcesample sizearray format 1. Miller-Liu: unpublished 61 tumors: 39 ER+, 22 ER- 19K spotted oligo 2. Sotiriou-Liu: submitted: PNAS 99 tumors: 34 ER+, 65 ER- 7.6K spotted cDNA 3. Gruvberger-Meltzer: Cancer Research 47 tumors: 23 ER+, 24 ER- 6.7K spotted cDNA 4. Sorlie-Borrensen-Dale: PNAS 74 tumors: 56 ER+, 18 ER- 8.1K spotted cDNA 5. van’t Veer-Friend: Nature 98 tumors: 59 ER+, 39 ER- 25K spotted oligo 6. West-Nevins: PNAS 49 tumors: 25 ER+, 24 ER- 7.1K Affymetrix total: 428 tumors, ~73,500 probes
META MADB: The Construct Building the Matrix • Extract and Format the Data • Link sample/probe info via unique keys • Log Transform and Normalize • Filter Genes and Arrays • Apply Statistical Tests Creating a Universe • Apply UniGene ID as Unifying Key • Remove Gene Redundancy • Extract p values, d values, z-scores • Set p value threshold • Merge Datasets
T1 T2 T3 T4 T5 …Tn e1 e1 e2 e2 e3 e3 e4 e4 e5 e5 …en …en T1 T2 T3 T4 T5 …Tn d values (difference of average expression) ER+ ER- gene1 : d = average e [ER+] / average e [ER-]
Identifying Grade-Specific Genes in Hepatocellular Carcinoma HCC Grade 1, 2, 3 Adenomatous hyperplasia ordinary atypical OAH AAH G1 G2 G3 Pre-neoplastic lesions HCC Progression • Sample: 10 cases of each class • Sample collection: HBV(+) • Array: Human 19K Oligonucleotide array • Analysis : 50 arrays
Identifying Grade-Specific Genes in Hepatocellular Carcinoma
Identifying Grade-Specific Genes in Hepatocellular Carcinoma
BC HCC Breast Cancer Grade-Associated Genes as Predictors of HCC Grade?
Breast Cancer Grade-Associated Genes as Predictors of HCC Grade? HCC
E2 E2 + ICI E2 + CHX Estrogen-Responsive in vitro and ER Status-Associated in vivo (p<0.001) 1 2 3 4 5 6
Identifying Cancer-Linked Genes in Epithelial Adenocarcinomas Datasets: 3 gastric, 3 prostate, 2 liver, 1 lung
242 Genes that Distinguish Tumor from Normal at p<0.001 in at least 3 of the 4 Tumor Types selection at p<0.001
Summary An Integrated Database for Pan-Cancer Meta-Analysis of Gene Expression Data • database components: • internal and external datasets derived from: • tumor studies (clinical samples) • in vitro, pathway studies (eg, timecourse) • SAGE data • mouse studies (in vitro/in vivo)
Future Directions • Derive expression signatures for all major factors known or suspected to have prognostic value • Determine the reliability of expression signatures in outcome prediction • Expand integrated database for pan- cancer meta-analysis • Integrate expression profiling into clinical decision making
Acknowledgements GIS Adai Ramasamy Liza Vergara Phil Long Chin-Yo Lin Benjamin Mow Catholic University of Korea Suk-Woo Nam Jung Yong Lee