Download
1 / 60
600 likes | 690 Views
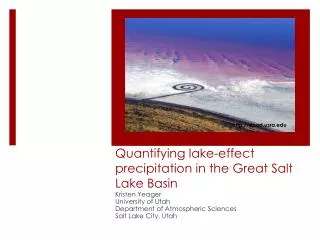
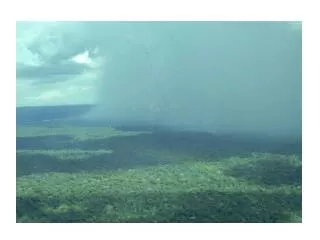
XIII) Landscape and precipitation in the eastern Amazon Basin I David R. Fitzjarrald Atmospheric Sciences Research Center University at Albany, SUNY US of A fitz@asrc.albany.edu. Solstice! June 21, 2011 1416 LT. Today ( the summer solstice for this turista ):

E N D
XIII) Landscape and precipitation in the eastern Amazon Basin I David R. Fitzjarrald Atmospheric Sciences Research Center University at Albany, SUNY US of A fitz@asrc.albany.edu Solstice! June 21, 2011 1416 LT
Today (the summer solstice for this turista): Some aspects of larger scale studies of precipitation in Amazônia. (visiting the community of faith in climatology) “dados” description statistical inference ‘causality’ ! Tomorrow: Issues that spring from local and regional and local landscape effects on of precipitation in Amazônia. (visiting the community of empiricism, observation and identification of mechanism. )
A continuing objective—to find new results & present them as the ‘deviation from the known result.’ R = <R> + R’
1922 1907 Need to assess recent work in terms of what NEW information is presented.
Not all stations reporting at the same time. Sombroek (2001)
TRMM 1998-2009 Glimmer of information about topographic effects on rainfall in the eastern Basin. Big hole over STM? Paiva et al. (2011)
ANEEL NCEP NCEP - ANEEL Who are you going to trust? Does data quality have any effect on your conclusions? Will you only accept data in neatly gridded rows?
FazendaTaperinha (east of Santarém) E E E E E E E E E E E E E Find the ENSO signal, please! Dr. Julio Tóta (personal communication)
Pbelem DPBelStm T U SOI Prec Santarém
1997 1998 1999 2000 El Niño and other interannual variability.
Trends in precipitation? Role of external forcing. Cycles!
Chuva Chen et al. (2001)
EÑ Rao et al. (2002) Before the 2005, 2010 Amazon droughts, many thought that ENSO forcing was solely responsible; later the NAO & tropical Atlantic temperatures have also been emphasized. “You’ve got to believe…” NCEP ANEEL
Northern basin Southern Basin Cloudiness, radiation trends? Arias et al. (2011)
Satyamurty et al. (2010) At some stations precipitation decreases; increases at others.
Accumulated knowledge: Trends? D’Almeida et al. (2007)
Pacific decadal oscillation PAO Fitting the data: do the shoes fit? North Atlantic oscillation NAO Precipitation time series Southern oscillation index ENSO
“All of the analysis is done for the period from January 1979 to December 2006. Interannual variability of each variable is constructed by removing the climatology based on the period of 1979–2006 for each calendar month. Then, a low-pass filter with an 18-month cutoff using a 2nd order Butterworth filter (Murakami 1979) is applied. All the analysis is performed on these filtered data…” Filter for what you seek?; Final correlations ≈ 0.4 r2 ≈ 0.16? Fig. 8 Correlation map of North Atlantic SST, ENSO, and South Atlantic SST indices with rainfall and SST during the Amazon’s dry (June–October) and wet (December–April) seasons like Fig. 2. Dotted areas are statistically significant at the 95% confidence level, using a sample size of 28 years
2005 2010 Standard anomalies. Droughts not felt as intensely in the eastern Amazon Basin Droughts cited as demonstration of the likely effects of global climate change. The 2010 Amazon Drought Simon L. Lewis, Paulo M. Brando, Oliver L. Phillips, Geertje M. F. van derHeijden, Daniel Nepstad Nature 331, 2011
"The combined effects of tropical Pacific and Atlantic SSTs explain 53% of the Amazon rainfall variability, with comparable contribution from the Pacific and the Atlantic.” Causes and Impact of the 2005 Amazon Drought, 2008. NingZeng, Jin-Ho Yoon, Jose A. Marengo, AjitSubramaniam, Carlos A. Nobre, Charon M. Birkett Causality inferred, (small) correlation observed… (but only after careful filtering an massaging of the data.) Mahli and Wright (2004) Figure 6. Maps of maximum correlation (within ± 6 months) between the ENSO index and the temperature anomaly.
Long-term trends and cycles in the hydrometeorology of the Amazon basin since the late 1920s Marengo (2009) “The presence of cycles rather than a trend is characteristic of rainfall in the Amazon.”
Fooling around with ENSO/NAO can give the Researcher a lot of ways to ‘fit’ the data. Reminds this old guy of Ptolemaic epicycles, Used to explain the geocentric solar system. Cycles circling cycles…. Claudius Ptolemy 200 AD (actual photograph) Merlin
Diurnal, transient and topographic effects – 1 (more in tomorrow’s presentation)
Diurnal precipitation from TRMM (Yang & Smith, J. Climate 2006)
Detail Fig. 9: Diurnal precipitation from TRMM (Yang & Smith, J. Climate 2006)
1800 – 0600 LST Passive microwave Diurnal variability 2100 – 0900 LST (Negri et al., 2000)
Passive microwave Topographic precipitation enhancement? More details tomorrow! (Negri et al., 2000)
TRMM diurnal rainfall estimates Paiva et al. (2011) Too coarse to demonstrate regional differences—more in the 2nd lecture…
Dry season average CMORPH rainfall top: day; bottom: night Fitzjarrald et al. (2008)
Wet season average CMORPH rainfall top: day; bottom: night Fitzjarrald et al. (2008)
Climatology : Rain (%) (15 to 0 UTC) Rain (%) (00 to 09 UTC) Cohen (2010)
Need to know not just total rainfall—but also types of rainfall.
Influence of large scale ‘instability lines’ on precipitation in eastern Amazônia: provides a nocturnal rainfall maximum? 18-21 UTC 00-03 UTC 12-15 UTC 06-09 UTC 06-09 UTC 12-15 UTC 00-03 UTC 18-21 UTC Where? When? Time of ‘maximum precipitation rate’ (From Kousky et al. 2006, CMORPH analyses)
Squall Lines : 2000 to 2006 CCL: Costal Convective Line ( Propagation < 170 km) SL1: Squall Line Type 1 ( 170 Km <Propagation < 400 km) SL2: Squall Line Type 2 ( Propagation > 400 km) SL2 – STM – Moved around Santarem Cohen (2010)
Angelini et al. (2011) COS BOS LOS
Precipitation recycling (or not) % recycled recycled total
Recycling of water vapor: estimates steadily dropping from 50% (1980’S) to 20—30% today (and some think it is largely irrelevant. 0.3 0.2 0.4 0.1 Van derEnt (2011) Characteristic scale for moisture recycling in the Amazon ≈ 3500 km. (effect most important near Andes.)
2011 A good part of the moisture for the rainfall comes from the ocean. Surprise?!
…but only the moisture flux divergence makes any difference… (Carvalho et al, 2011)
ETA reanalysis, P gradients Weak pressure gradients are all that are needed in the tropics.
Amazon Basin inflow perturbed by hurricane passing to the N.—the pressure gradient can also be relaxed by friagem. (P. L. Silva Dias, personal communication) “glassy Tapajós”
Modeling simple along-trajectory flows Lintner and Neelin (2010)
Lagrangian models—lacking sufficient ‘ground truth’ Lin et al (2011)