Download
1 / 20
200 likes | 442 Views
3D GIS and Planning Analysis: Urban land use, density and sustainable development. CASE Award: ‘3D GIS for E-Planning’ Upgrade Presentation, 28/11/07 Duncan Smith. Seminar Outline. Introduction Sustainable Development and Urban Form London Context

E N D
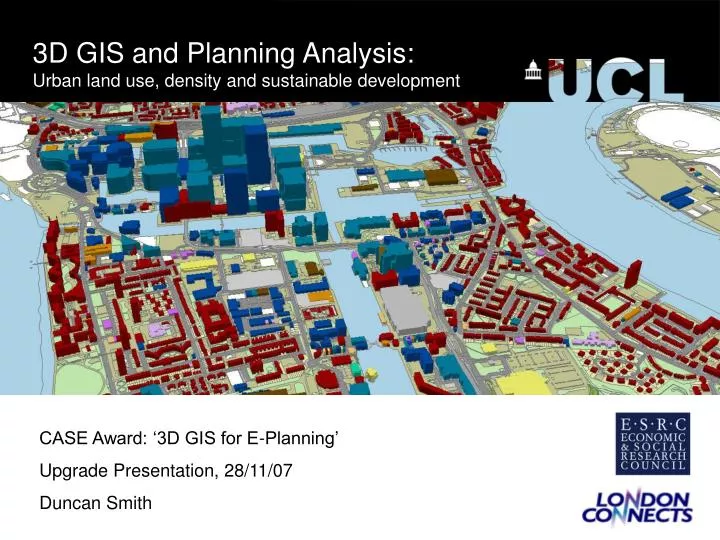
3D GIS and Planning Analysis: Urban land use, density and sustainable development CASE Award: ‘3D GIS for E-Planning’ Upgrade Presentation, 28/11/07 Duncan Smith
Seminar Outline • Introduction • Sustainable Development and Urban Form • London Context • Measuring Density and Public Transport Accessibility • Isle of Dogs and Stratford Case Studies • Discussion of Next Stages in Research
Introduction • Research Studentship part of Virtual London Project- • 3D GIS of London’s built environment (Batty, Hudson-Smith 2005) • Planning Analysis for Sustainable Development- • Develop Virtual London as a 3D GIS planning analysis tool (PSS). Use urban form and accessibility data for sustainable development indicators: • Density of urban form and public transport accessibility. • Mix of Uses and pedestrian accessibility. • “Policies for development should exploit their • public transport accessibility through higher densities and more mixed • and intensive use.” • GLA London Plan 2004, 2006 • Scale of Analysis • Focus on fine scale, incorporate urban form. Most decision making in planning incremental, small scale; typically analysis/modeling at aggregated scale. Research intended to bridge between scales, local urban form implications of larger scale trends.
3D GIS Planning Tool Concept New Development Details- Building Function(s): Residential Density: 50 dwelling units Density and PTAL: Exceeds minimum density for PTAL level Mix of Uses: Single use development, lowers street diversity. Building Query- Address: 10 Tramway Ave Building Function: Office Number Premises: 1 Business Name: Inland Revenue Floorspace: 800m2 Density (flrspc/footprint) 3 m/m Accessibility Query- PT Interchange travel times: Bus: 1min UG: 10min Rail: 10min PTAL Level: 6 (high) Street Integration (?)… Street Query- Mix of uses: Res, Off, Ret, Com. Density by use: num dwell, flrspc… Diversity Index (?) Street typology (?)
3D GIS Planning Tool Concept • Realistic Goals within research context- • Purpose not to create stand-alone software product. Focus on researching and developing- • Geodata infrastructure • Land use, density, accessibility data from standard sources. • Methodology for sustainable development indicators • Quantitative analysis of relationships between density, mix of uses and accessibility. • 3D interface and visualisations • Intuitive 3D visualisations of analysis within mainstream GIS.
Urban Form and Sustainable Travel • Influential research in sustainable urban form- • Jacobs (1961)- powerful critique of modernist planning. In favour of small scale pedestrian mixed use cities. Vitality, community and safety in cities. • Newman and Kenworthy (1989)- correlation between urban density and energy use in cities across world. Criticised but influential. • Integrated within ‘Compact City’ movement (Jenks et al, 1996)- • High density, mixed use cities. Shorter trip lengths, public transport feasible. • Minimise greenbelt development, constrain sprawl. • Pedestrian/cycle friendly environment. Car use restricted. • ‘Sustainable communities’- linked to community and equality issues. • Criticisms of concept- • Ignoring new economy of ‘Edge Cities’- creating explosive growth around ring roads and airports. Argued travel patterns more efficient (Gordon & Richardson, 1996). • Monocentric city- congested radial transport links. Wasted public transport capacity with no reverse commuting. Dormitory suburbs with longer commuting. • Too loosely defined concept. • New consensus (?) around ‘Concentrated Deconcentration’- • High density public transport nodes developments at edge of centre locations (e.g. Amsterdam Zuid, Canary Wharf)
London and South East Region • London employment structure highly monocentric: • Current city centre boom increasing dominance. • London a ‘Compact City’? • Urban growth during rail era, evolved as compact city. High density centre and radial transport infrastructure. Reflected in travel patterns. • South East regional trends: • Growth jumped green belt to outer metropolitan area. IT growth at M4 corridor (access to wider UK and Heathrow). Car orientated development less sustainable. • East-West split (transport rich/poor corridors) • London Plan and regeneration • Major theme of plan to direct growth to East London, bring together regeneration, equity, sustainable dev concerns. Transport Infrastructure: • Channel Tunnel Rail Link. • Crossrail.
Urban Form and the London Plan • ‘Opportunity Areas’- • London’s growth is planned at high density employment clusters at public transport nodes. • Brownfield redevelopment e.g. Kings Cross, Paddington Basin. • Multiple connected regeneration schemes: • Canary Wharf/Isle of Dogs- massive scale regeneration project, started in 1980s. • Stratford/Olympics, Lower Lea Valley- more recent regeneration scheme in early stages. • Wider Thames Gateway regional plan.
Research Questions • How closely is urban density related public transport accessibility at the Opportunity Areas? • Is the large scale high density nature of development creating a disintegrated urban texture? • Need to be able to measure density and accessibility to answer these questions.
Measuring Density • Scale of Analysis- • This research interested in fine scale measures linked to urban form • Building level-direct link to urban form. Divide total dwellings/floorspace by building footprint area. • Density Measures- • Residential measures- dwellings per hectare standard. • Commercial measures- employees per hectare. Floorspace as a proxy. Basic classification: office, retail and industrial. • Data Sources- • Address Data- OS AL2 complete UK addresses with spatial location. Accurate residential and less accurate commercial classification. Regularly updated. • Floorspace Data- Valuation Office has floorspace data for all commercial premises. Last updated in 2005. Currently linking to OS data problematic, working with postcode units for the meantime.
Public Transport Accessibility • Defining Accessibility • Availability of opportunities (e.g. PT service) weighted by difficulty of getting there (e.g. distance). • User centred view of transport system. • Public Transport Accessibility Level • PTAL standard measure in London. Method: • For each output area calculate PT interchanges within walk distance thresholds (vary by mode) on road network. • Total services available weighted by their frequency, reliability factor and cost of walking there. • Measures used for density and parking standards of new development across London. • Improving PTAL Measure • Simplicity of PTALs helps popularity, but also has drawbacks: • No detailed pedestrian accessibility. • Does not consider utility of services. • Does not consider crowding/capacity of services.
Example of Canary Wharf and Isle of Dogs • Symbol of economic ‘creative destruction’- • Docks facilitating London’s huge international trade. Rapid decline in 1970s. • ‘Biggest brownfield site in Europe’. Set up as UDC. • Olympia York get go-ahead for gigantic business district. • Developer goes bust in early 1990s recession. • Transport Links Key to Growth- • Business centre perceived as isolated. PT enhanced with DLR upgrade and Jubilee line. • Incredible jobs growth over last ten years to 80,000+. • PT dominates mode share, similar to central London. • Questions for research- • Is the density of new development closely related to public transport accessibility? • Is the large scale high density form of Canary Wharf integrated with surrounding areas?
Isle of Dogs Density Analysis • Summary- • Distinct distributions of land uses at this fine scale. • Density and PTAL measure strongly related for large scale commercial uses. DLR successful catalyst for physical regeneration on Isle of Dogs, Canary Wharf not isolated. • New residential development taking place at very high density on riverside locations. Minimal relationship with public transport, and not encouraging a mixed use active street environment. • Methodological issues- • Visual analysis should be complimented with statistical analysis (need TfL model) • Property focussed method rather than business focussed. Business size, business type information, industrial businesses? • Which social groups benefiting from physical regeneration?
Future plans for Isle of Dogs • Tower Hamlets Council taking proactive role in guiding new development. Masterplans for high density districts around DLR stations. • Millennium Quarter Masterplan (2000)- • Highest densities at DLR station. Gradual change in building heights. • Improve mix of uses and pedestrian permeability. • Successful? • Attracting development, improved active streets with ground floor retail. • “Residential market outperforming the office market. High rise residential has values up to £10,764 m2”(LOPR, 2006). • Luxury character to development. Replacing small business offices. Affordable housing? • Physical regeneration methodology needs to consider social issues.
Physical Regeneration and Social Impacts • Successful economic regeneration but social impacts questioned: • Evidence of mismatch between business service jobs created and local skills (Foster, 1999). Education and skills funding from LDDC low. New affluent residents distinct from older community. • Failing to achieve regeneration aims? • Demographic analysis compliment built form analysis: • Large population increase. Unemployment fallen, though not as much as Tower Hamlets as a whole. Evidence of local jobs, but who for? • Need to do further analysis including socio-economic groups data. Also migration data. • Built Form Indicators Relevant to Regeneration- • Affordable housing provision- Tower Hamlets building more affordable homes than any other London Borough. 2,700 homes 2005-06 (132% percent London Plan target). • Regeneration and Small and Medium Enterprises- Key sector for high ethnic diversity and high deprivation areas. Tower Hamlets mapped small businesses using VO data.
Stratford Case Study • Can Stratford avoid making Docklands early mistakes? • Town centre in the East London borough of Newham. Chosen as site for main Olympic development: • Strong public transport links with two tube lines, rail and bus connections. Future links CTRL and Crossrail. • Newham amongst most deprived authorities in UK. Regeneration focus. • Large area of brownfield railway lands to the west towards Hackney Wick. • Synergy with pre-Olympic plan for ‘Stratford City’, retail led development on same site. • Link between old town centre and new development of key importance.
Stratford Density Analysis • Summary- • Higher density commercial uses around shopping centre with good public transport access. Much lower density than Isle of Dogs development. • Low density commercial on local high streets. • Main issues surrounding form of future development at Stratford.
New Development in Stratford • Planning applications- • Applications include all the geometric, functional and floor space data. Not standardised in a spatial database. • Major developments include 3D CAD models (aesthetic), really looking for geometric and functional model. • Development Trends in Stratford • Lots of applications for high rise residential developments, some better than others… • High Rise Proposals- • 310 High Street- 30-storey tower proposed (334 flats and a hotel). • GLA object to scale, design: “wide slab block”, “inappropriate façade”, “poor configuration at ground level”, ”fails to provide a landmark building of high design quality”. • ‘Olympian’ Tower- 26 storey mixed use tower. Ground floor retail, 5 floors office, 280 residential units. • Conclusions on including proposed developments- • Density not only issue! – Development can encourage sustainable travel while being highly unsuitable on aesthetic grounds. • Challenge in automating process of adding new development data.
Conclusions on Analysis Methods • Density and PTAL Analysis- • Analysis powerful way to visualise fine scale land use distributions in relation to accessibility. Useful tool for planners making sustainable development assessments. • Case studies show high density commercial development closely related to PTAL measure. Traditional residential and new high rise residential different spatial patterns. • Potential improvements: • business classification data • pedestrian accessibility in PTAL analysis. • Fuller understanding of social aspects of regeneration. • Automatic methods of adding new development. • Plans for taking research forward: • Public Transport Accessibility- Need to fully test PTAL measure. Currently accepting measure without rigorous testing. Potential improvements. • Affordable Housing- research with GLA looking at affordable housing provision, house prices and regeneration at fine scale. • Case Study Areas- Need more contrasting case studies, so far too similar. Perhaps Outer London, much less PT focussed. • Develop mix of use measures and pedestrian accessibility- Consider measures around mix of uses to encourage local travel. Mix of uses measure require assessing how related buildings are in the street network, i.e. pedestrian accessibility. • Local Authority Feedback- need more planner input to evaluate analysis methods.
Thank you for listening! • Welcome any comments and questions. • References • Batty, M. & Hudson-Smith, A. (2005), Urban Simulacra: London, Architectural Design, Vol 5, 6, pp 42 – 47. • Breheny,M.,Gordon,I.,Archer,S.(1998), ‘Building densities and sustainable cities’, Engineering and Physical Sciences Research Council (EPSRC), Sustainable Cities Programme, Project Outline No. 5, June 1998. • Burton, E. (2002), Measuring urban compactness in UK towns and cities, Environment and Planning B: Planning and Design 2002, 29, pp 219 – 250. • Foster (1999), Docklands: Cultures in Conflict, Worlds in Collision, UCL Press, London. • GORDON, P. and RICHARDSON, H. (1996) Beyond polycentricity: the dispersed metropolis, LosAngeles, 1970-1990, Journal of the American Planning Association, 62, pp. 289±295. • Greater London Authority (2004), The London Plan: Spatial Development Strategy for London, GLA. • Greater London Authority (2006), London Office Policy Review 2006, GLA. • Jane Jacobs (1961) The Death and Life of Great American Cities New York: Vintage Books (NA 9108.J17); • Jenks, M, Burton, E., Williams, K. (2000) The Compact City: A Sustainable Urban Form?, (Spon. London). • Newman & Kenworthy (1989), Overcoming Automobile Dependence, Island Press, Washington.