Download
1 / 57
570 likes | 713 Views
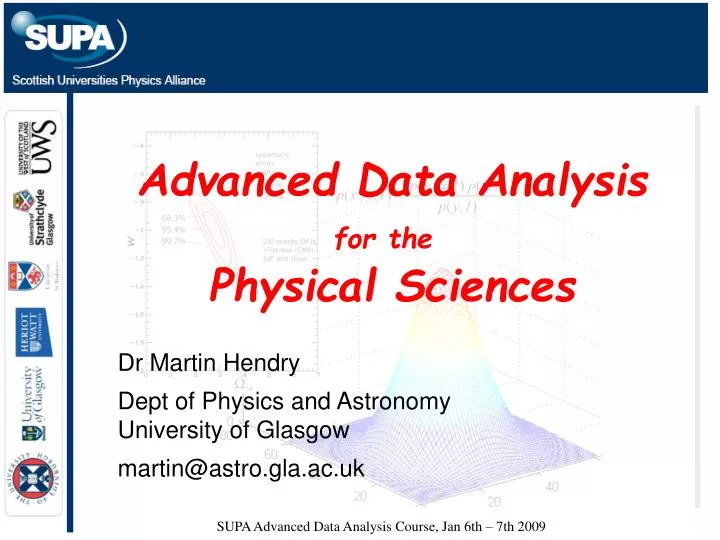
Advanced Data Analysis for the Physical Sciences. Dr Martin Hendry Dept of Physics and Astronomy University of Glasgow martin@astro.gla.ac.uk. SUPA Advanced Data Analysis Course, Jan 6th – 7th 2009. SUPA Advanced Data Analysis Course, Jan 6th – 7th 2009. Advanced Numerical Methods

E N D
Advanced Data Analysis for the Physical Sciences Dr Martin Hendry Dept of Physics and Astronomy University of Glasgow martin@astro.gla.ac.uk SUPA Advanced Data Analysis Course, Jan 6th – 7th 2009
SUPA Advanced Data Analysis Course, Jan 6th – 7th 2009 • Advanced Numerical Methods • Part 1: Monte Carlo Methods • Part 2: Fourier Methods
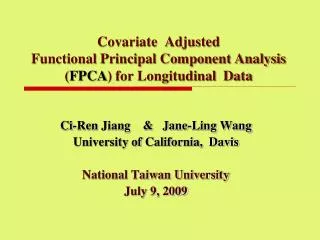
SUPA Advanced Data Analysis Course, Jan 6th – 7th 2009 Part 1: Monte Carlo Methods 1. Uniform random numbers Generating uniform random numbers, drawn from the pdf U[0,1], is fairly easy. Any scientific Calculator will have a RAN function… Better examples of U[0,1] random number generators can be found in Numerical Recipes. p(x) 1 http://www.numerical-recipes.com/ x 1 0
6.1. Uniform random numbers Generating uniform random numbers, drawn from the pdf U[0,1], is fairly easy. Any scientific Calculator will have a RAN function… Better examples of U[0,1] random number generators can be found in Numerical Recipes. In what sense are they better?… p(x) 1 http://www.numerical-recipes.com/ x Algorithms only generatepseudo-random numbers: very long (deterministic) sequences of numbers which are approximately random (i.e. no discernible pattern). The better the RNG, the better it approximates U[0,1] 1 0
x 1 0 We can test pseudo-random numbers for randomness in several ways: (a) Histogram of sampled values. We can use hypothesis tests to see if the sample is consistent with the pdf we are trying to model. e.g. Chi-squared test, applied to the to the numbers in each histogram bin.
x 1 0 We can test pseudo-random numbers for randomness in several ways: (a) Histogram of sampled values. We can use hypothesis tests to see if the sample is consistent with the pdf we are trying to model. e.g. Chi-squared test, applied to the to the numbers in each histogram bin. Assume the bin number counts are subject to Poisson fluctuations, so that Note: no. of degrees of freedom =nbin– 1 since we know the total sample size.
SUPA Advanced Data Analysis Course, Jan 6th – 7th 2009 (b) Correlations between neighbouring pseudo-random numbers Sequential patterns in the sampled values would show up as structure in the phase portraits – scatterplots of the ith value against the (i+1)th value etc. (see Gregory, Chapter 5)
(b) Correlations between neighbouring pseudo-random numbers Sequential patterns in the sampled values would show up as structure in the phase portraits – scatterplots of the ith value against the (i+1)th value etc. We can compute the Auto-correlation function jis known as the Lag If the sequence is uniformly random, we expect { r(j) = 1 for j = 0 r(j) = 0 otherwise
6.2. Variable transformations Generating random numbers from other pdfs can be done by transforming random numbers drawn from simpler pdfs. The procedure is similar to changing variables in integration. Let be monotonic Then Suppose, e.g. Probability of number between y and y+dy Probability of number between x and x+dx Because probability must be positive
SUPA Advanced Data Analysis Course, Jan 6th – 7th 2009 We can extend the expression given previously to the case where is not monotonic, by calculating so that
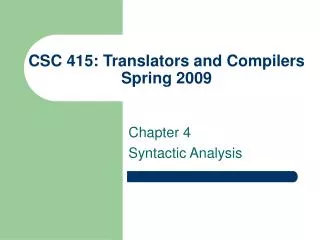
1 b-a y a 0 p(x) Example 1 Suppose we have Then Define So i.e. or 1 x 1 0 p(y) b
SUPA Advanced Data Analysis Course, Jan 6th – 7th 2009 Normal pdf with mean zero and standard deviation unity Example 2 Numerical recipes provides a program to turn into Suppose we want We define so that Now so
Normal pdf with mean zero and standard deviation unity Example 2 Numerical recipes provides a program to turn into Suppose we want We define so that Now so Variable transformation formula also the basis for ‘error propagation’ formulae we use in data analysis - see also SUPAIDA course
Question 13: If and , the pdf of is A B C D
Question 13: If and , the pdf of is A B C D
SUPA Advanced Data Analysis Course, Jan 6th – 7th 2009 6.3. Probability integral transform One particular variable transformation merits special attention. Suppose we can compute the CDF of some desired random variable
SUPA Advanced Data Analysis Course, Jan 6th – 7th 2009 • Sample a random variable • Compute such that i.e.
SUPA Advanced Data Analysis Course, Jan 6th – 7th 2009 • Sample a random variable • Compute such that i.e.
SUPA Advanced Data Analysis Course, Jan 6th – 7th 2009 • Sample a random variable • Compute such that i.e. • Then i.e. is drawn from the pdf corresponding to the cdf
SUPA Advanced Data Analysis Course, Jan 6th – 7th 2009 Example (from Gregory)
Sample from • Sample SUPA Advanced Data Analysis Course, Jan 6th – 7th 2009 6.4. Rejection sampling Suppose we want to sample from some pdf and we know that (Suppose we have an ‘easy’ way to do this)
Sample from • Sample SUPA Advanced Data Analysis Course, Jan 6th – 7th 2009 6.4. Rejection sampling Suppose we want to sample from some pdf and we know that (Suppose we have an ‘easy’ way to do this) • If ACCEPT • otherwise REJECT
Sample from • Sample SUPA Advanced Data Analysis Course, Jan 6th – 7th 2009 (following Mackay) 6.4. Rejection sampling Suppose we want to sample from some pdf and we know that (Suppose we have an ‘easy’ way to do this) • If ACCEPT • otherwise REJECT Set of accepted values are a sample from
SUPA Advanced Data Analysis Course, Jan 6th – 7th 2009 6.4. Rejection sampling Method can be very slow if the shaded region is too large. Ideally we want to find a pdf that is: (a) easy to sample from (b) close to
SUPA Advanced Data Analysis Course, Jan 6th – 7th 2009 6.5. Genetic Algorithms (Charbonneau 1995)
SUPA Advanced Data Analysis Course, Jan 6th – 7th 2009 6.5. Genetic Algorithms (Charbonneau 1995)
SUPA Advanced Data Analysis Course, Jan 6th – 7th 2009 6.5. Genetic Algorithms (Charbonneau 1995)
SUPA Advanced Data Analysis Course, Jan 6th – 7th 2009 6.5. Genetic Algorithms see http://www.hao.ucar.edu/Public/models/pikaia/pikaia.html
SUPA Advanced Data Analysis Course, Jan 6th – 7th 2009 6.5. Genetic Algorithms see http://www.hao.ucar.edu/Public/models/pikaia/pikaia.html
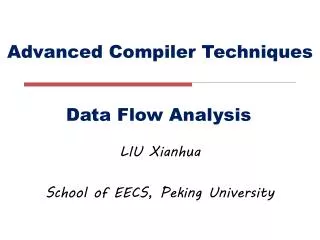
Angular power spectrum of CMBR temperature fluctuations ML cosmological model, depending on 7 different parameters. 6.6. Markov Chain Monte Carlo This is a very powerful, new (at least in astronomy!) method for sampling from pdfs. (These can be complicated and/or of high dimension). MCMC widely used e.g. in cosmology to determine ‘maximum likelihood’ model to CMBR data. (Hinshaw et al 2006)
SUPA Advanced Data Analysis Course, Jan 6th – 7th 2009 • Consider a 2-D example (e.g. bivariate normal distribution); • Likelihood function depends on parameters a and b. • Suppose we are trying to find the • maximum of • Start off at some randomly • chosen value • Compute and gradient • Move in direction of steepest • +ve gradient – i.e. is • increasing fastest • Repeat from step 2 until converges on maximum of likelihood L(a,b) L(a,b) ( a1 , b1 ) L( a1 , b1 ) L( a1 , b1 ) a b ( an , bn )
Consider a 2-D example (e.g. bivariate normal distribution); • Likelihood function depends on parameters a and b. • Suppose we are trying to find the • maximum of • Start off at some randomly • chosen value • Compute and gradient • Move in direction of steepest • +ve gradient – i.e. is • increasing fastest • Repeat from step 2 until converges on maximum of likelihood L(a,b) L(a,b) ( a1 , b1 ) L( a1 , b1 ) L( a1 , b1 ) a b ( an , bn ) OK for finding maximum, but not for generating a sample from or for determining errors on the the ML parameter estimates. L(a,b)
SUPA Advanced Data Analysis Course, Jan 6th – 7th 2009 MCMC provides a simple Metropolis algorithm for generating random samples of points from L(a,b) Slice through L(a,b)
SUPA Advanced Data Analysis Course, Jan 6th – 7th 2009 MCMC provides a simple Metropolis algorithm for generating random samples of points from L(a,b) • Sample random initial point P1 = ( a1 , b1 ) P1 Slice through L(a,b)
SUPA Advanced Data Analysis Course, Jan 6th – 7th 2009 MCMC provides a simple Metropolis algorithm for generating random samples of points from L(a,b) • Sample random initial point • Centre a new pdf, Q, called the • proposal density, on P1 = ( a1 , b1 ) P1 P1 Slice through L(a,b)
SUPA Advanced Data Analysis Course, Jan 6th – 7th 2009 MCMC provides a simple Metropolis algorithm for generating random samples of points from L(a,b) • Sample random initial point • Centre a new pdf, Q, called the • proposal density, on • Sample tentative new point • from Q P1 = ( a1 , b1 ) P1 P1 P’ P’ = ( a’ , b’ ) Slice through L(a,b)
SUPA Advanced Data Analysis Course, Jan 6th – 7th 2009 MCMC provides a simple Metropolis algorithm for generating random samples of points from L(a,b) • Sample random initial point • Centre a new pdf, Q, called the • proposal density, on • Sample tentative new point • from Q • Compute P1 = ( a1 , b1 ) P1 P1 P’ P’ = ( a’ , b’ ) Slice through L(a,b)
SUPA Advanced Data Analysis Course, Jan 6th – 7th 2009 • IfR > 1 this means is uphill from . • We accept as the next point in our chain, i.e. • If R < 1 this means is downhill from . • In this case we may reject as our next point. • In fact, we accept with probability R . P’ P1 P’ P2 = P’ P’ P1 P’ P’ How do we do this?… (a) Generate a random number x ~ U[0,1] (b) If x < R then accept and set (c) If x > R then reject and set P’ P2 = P’ P’ P2 = P1
IfR > 1 this means is uphill from . • We accept as the next point in our chain, i.e. • If R < 1 this means is downhill from . • In this case we may reject as our next point. • In fact, we accept with probability R . P’ P1 P’ P2 = P’ P’ P1 P’ P’ How do we do this?… (a) Generate a random number x ~ U[0,1] (b) If x < R then accept and set (c) If x > R then reject and set P’ P2 = P’ P’ P2 = P1 Acceptance probability depends only on the previous point - Markov Chain
SUPA Advanced Data Analysis Course, Jan 6th – 7th 2009 So the Metropolis Algorithm generally (but not always) moves uphill, towards the peak of the Likelihood Function. Remarkable facts Sequence of points represents a sample from the LF Sequence for each coordinate, e.g. samples the marginalised likelihood of We can make a histogram of and use it to compute the mean and variance of ( i.e. to attach an error bar to ) { } P1 , P2 , P3 , P4 , P5 , … L(a,b) { } a1 , a2 , a3 , a4 , a5 , … a { } a1 , a2 , a3 , a4 , a5 , …, an a a
Why is this so useful?… Suppose our LF was a 1-D Gaussian. We could estimate the mean and variance quite well from a histogram of e.g. 1000 samples. But what if our problem is, e.g. 7 dimensional? ‘Exhaustive’ sampling could require (1000)7 samples! MCMC provides a short-cut. To compute a new point in our Markov Chain we need to compute the LF. But the computational cost does not growso dramatically as we increase the number of dimensions of our problem. This lets us tackle problems that would be impossible by ‘normal’ sampling. No. of samples Sampled value
Angular power spectrum of CMBR temperature fluctuations ML cosmological model, depending on 7 different parameters. SUPA Advanced Data Analysis Course, Jan 6th – 7th 2009 Example: CMBR constraints from WMAP 3 year data ( + 1 year data) (Hinshaw et al 2006)
Question 14: When applying the Metropolis algorithm, if the width of the proposal density is very small A the Markov Chain will move around the parameter space very slowly B the Markov Chain will converge very quickly to the true pdf C the acceptance rate of proposed steps in the Markov Chain will be very small D most steps in the Markov Chain will explore regions of very low probability
Question 14: When applying the Metropolis algorithm, if the width of the proposal density is very small A the Markov Chain will move around the parameter space very slowly B the Markov Chain will converge very quickly to the true pdf C the acceptance rate of proposed steps in the Markov Chain will be very small D most steps in the Markov Chain will explore regions of very low probability
SUPA Advanced Data Analysis Course, Jan 6th – 7th 2009 • A number of factors can improve the performance of the Metropolis algorithm, including: • using parameters in the likelihood function which are (close to) • independent (i.e. their Fisher matrix is approx. diagonal). • adopting a judicious choice of proposal density, well matched to the • shape of the likelihood function. • using a simulated annealing approach – i.e. sampling from a modified • posterior likelihood function of the form • for large the modified likelihood is a flatter version of the • true likelihood
SUPA Advanced Data Analysis Course, Jan 6th – 7th 2009 Temperature parameter starts out large, so that the acceptance rate for ‘downhill’ steps is high – search is essentially random. (This helps to avoid getting stuck in local maxima) is gradually reduced as the chain evolves, so that ‘downhill’ steps become increasingly disfavoured. In some versions, the evolution of is carried out automatically – this is known as adaptive simulated annealing. See, for example, Numerical Recipes Section 10.9, or Gregory Chapter 11, for more details.
SUPA Advanced Data Analysis Course, Jan 6th – 7th 2009 A related idea is parallel tempering (see e.g. Gregory, Chap 12) Series of MCMC chains, with different , set off in parallel, with a certain probability of swapping parameter states between chains. High temperature chains are effective at mapping out the global structure of the likelihood surface. Low temperature chains are effective at mapping out the shape of local likelihood maxima.
SUPA Advanced Data Analysis Course, Jan 6th – 7th 2009 Example: spectral line fitting, from Section 3. Conventional MCMC MCMC with parallel tempering
SUPA Advanced Data Analysis Course, Jan 6th – 7th 2009 Example: spectral line fitting, from Section 3. Conventional MCMC MCMC with parallel tempering
Average likelihood, weighted by prior • Calculating the evidence can be computationally very costly • (e.g. CMBR spectrum in cosmology) • How to proceed?... • Information criteria (Liddle 2004, 2007) • Laplace and Savage-Dickey approximations • (Trotta 2005) • Nested sampling (Skilling 2004, 2006; http://www.inference.phy.cam.ac.uk/bayesys/ ) • (Mukherjee et al. 2005, 2007; Sivia 2006) SUPA Advanced Data Analysis Course, Jan 6th – 7th 2009 Approximating the Evidence