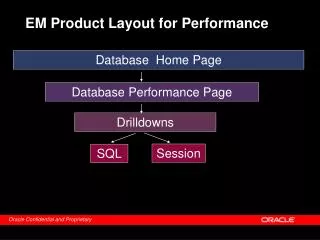
Download
1 / 32
320 likes | 402 Views
STS simulations: Layout, digitizers, performance. Radoslaw Karabowicz GSI. STS detector. Tracking detector: - low-mass detector - full azimuthal angle coverage - polar angle coverage: from 2.5° to 25 ° high track density in the inner-most region high collision rate

E N D
STS simulations:Layout, digitizers, performance Radoslaw Karabowicz GSI
STS detector • Tracking detector: • - low-mass detector • - full azimuthal angle coverage • - polar angle coverage: • from 2.5° to 25° • high track density in the inner-most region • high collision rate • vertical magnetic field
STS design Silicon Tracking System: 8 stations (at 30, 35, 40, 50, 60, 75, 90 and 100cm away from the target) build from micro-strip double-sided silicon sensors (~300mm thick, 6cm wide, 2÷6 cm high) with narrow strips (60mm): vertically oriented on the front side and slightly rotated on the back side (by 15°) readout electronics located in the bottom and top parts outside of defined acceptance sensor readout ensured by low-mass microcables small sensors in the inner region to reduce the occupancy, outer regions covered by larger sensors, or even chained sensors, to minimize number of channels
FEB with 8 s FEB with 8 s n-XY TER n-XY TER Module Cable Cable Silicon sensor 2-6cm ~6cm
Overlaps vs gaps gaps Example realizations of the station #3 at z=40cm overlaps intermediate 39.65 40 40.35
Overlaps vs gaps – tracking efficiency Overlap geometry Gap geometry overall efficiency 1 gap, 2 gaps 1 overlap, 2 overlaps Traversing overlaps does not change tracking efficiency Traversing gaps does change tracking efficiency Work done by the GSI Summer Student Maksym Zyzak from National University, Kyiv
Overlaps vs gaps – momentum resolution Overlap geometry Gap geometry overall resolution 1 gap, 2 gaps 1 overlap, 2 overlaps Traversing overlaps does not change momentum resolution Traversing gaps does change momentum resolution Work done by the GSI Summer Student Maksym Zyzak from National University, Kyiv
Realistic detector response Ideal response: Realistic response: The hit is determined by the track position in the center of the silicon detector • Physical processes: • charge smearing • collection efficiency • Lorentz angle due to magnetic field
Realistic response - models CMS @ LHC w/2 p/2 transverse tracks CBM: |B| = 1T Holes: Q = 1.5°, Dx = 8mm Electrons: Q = 7.5°, Dx = 40mm
Ideal Realistic Hit density 0-35 hits/cm2 0-31 hits/cm2 Strip occupancy 0-5.8% 0-11%
Ideal Realistic Cluster length 1 strip from definition of ideal response 1.4-2.3 strips Hit finding efficiency <eff> = 98.6% 94-100% <eff> = 91.9% 54-99%
Realistic response - results Ideal response: Realistic response:
Detector X-ray y[cm] x[cm] station 5 (z = 60cm) x/x0 Radiation length thickness 6 million 10 GeV/c pions in Geant STS detector x/x0 • - silicon detector thickness: • currently 0.3% x0 (300mm) • station with cables and support • structure: up to 1% x0 • total vertex/tracking system: < 15% x0
Summary (more)Realistic geometry that matches recent discussions on construction possibilities available (thanks to Sergey Belogurov) The geometry has been tested by Irina Rostovtseva, Maksym Zyzak and me More discussion with engineers needed The realistic digitizer and cluster finder ready Detector response study essential
Deltas – expected behavior Station 1 0.3 e- / beam particle Station 4 0.12 e- / beam particle Station 5 0.08 e- / beam particle
Deltas – surprising feature Station 6 0.15 e- / beam particle 0.05 – 0.1 Station 7 0.15 e- / beam particle 0.03 – 0.12 Station 8 0.03 e- / beam particle HEAR MORE ABOUT THIS FROM YOURI’s PRESENTATION
Ideal Realistic Hit density 0-35 hits/cm2 0-31 hits/cm2 Strip occupancy 0-5.8% 0-11%
Ideal Realistic Cluster length 1 strip from definition of ideal response 1.4-2.3 strips Hit finding efficiency <eff> = 98.6% 94-100% <eff> = 91.9% 54-99%
STS test beam early results Radoslaw Karabowicz GSI
FEB with FEB with n-XY TER n-XY TER Test beam setup Silicon sensor Silicon sensor
First signals from beta source 90Sr yield source source Time in epochs
First signals from beta source 90Sr yield Noise Beta source ADC channels
Beam in Cave C!!! Screams: Do we have beam?? yield Playing with threshold Time in epochs
Beam bunches Hits Beam counter Yield time [a.u.] .
Channel number correlations channel number Vertical strips Horizontal strips on detector 1 on detector 2 Horizontal strips Vertical strips channel number on detector 1 on detector 2
beam detector time – hit time [a.u.] channel number on roc1 (n side) Time correlations
Time correlations Run020 Run015
Summary Conclusions LOTS TO DO!!! to analyze and understand the data to prepare for next beam time